Alcoholics Anonymous Meeting Finder
This visualization maps Alcoholics Anonymous meetings in Manhattan happening within a certain distance and timeframe from your current location.
Process
Audience: Parsons Data Structures Course
Data Source: Alcoholics Anonymous of New York webpages (static copies of outdated meeting list pages, saved and published specifically for Parsons course)
Tools: Async / AWS RDS / Cheerio / CSS / EC2 / Express / Handlebars / HTML / JavaScript / Leaflet / Node / PostgreSQL / Web Scraping
Data
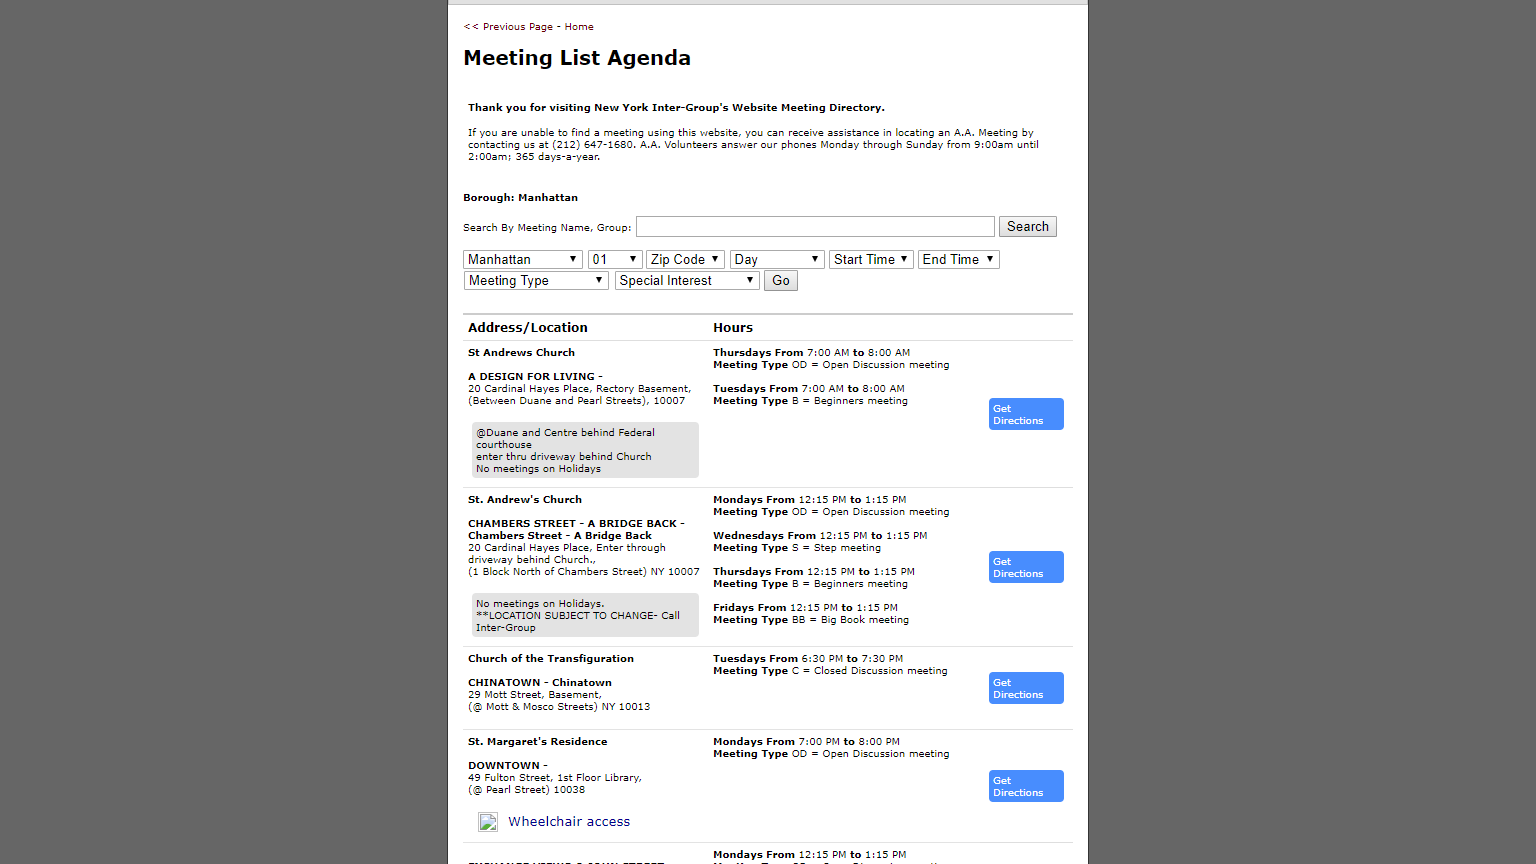
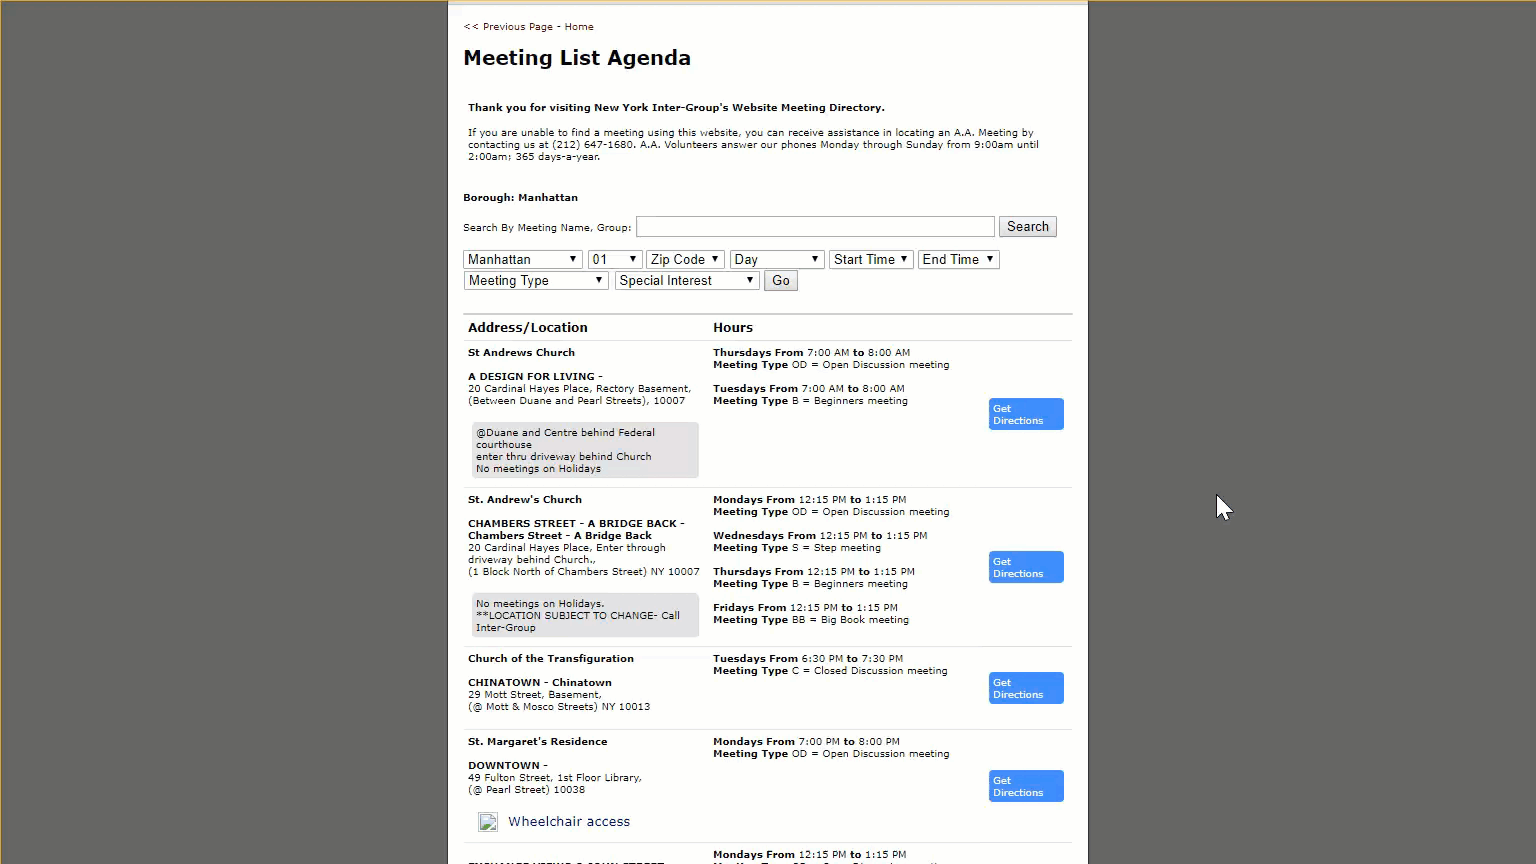
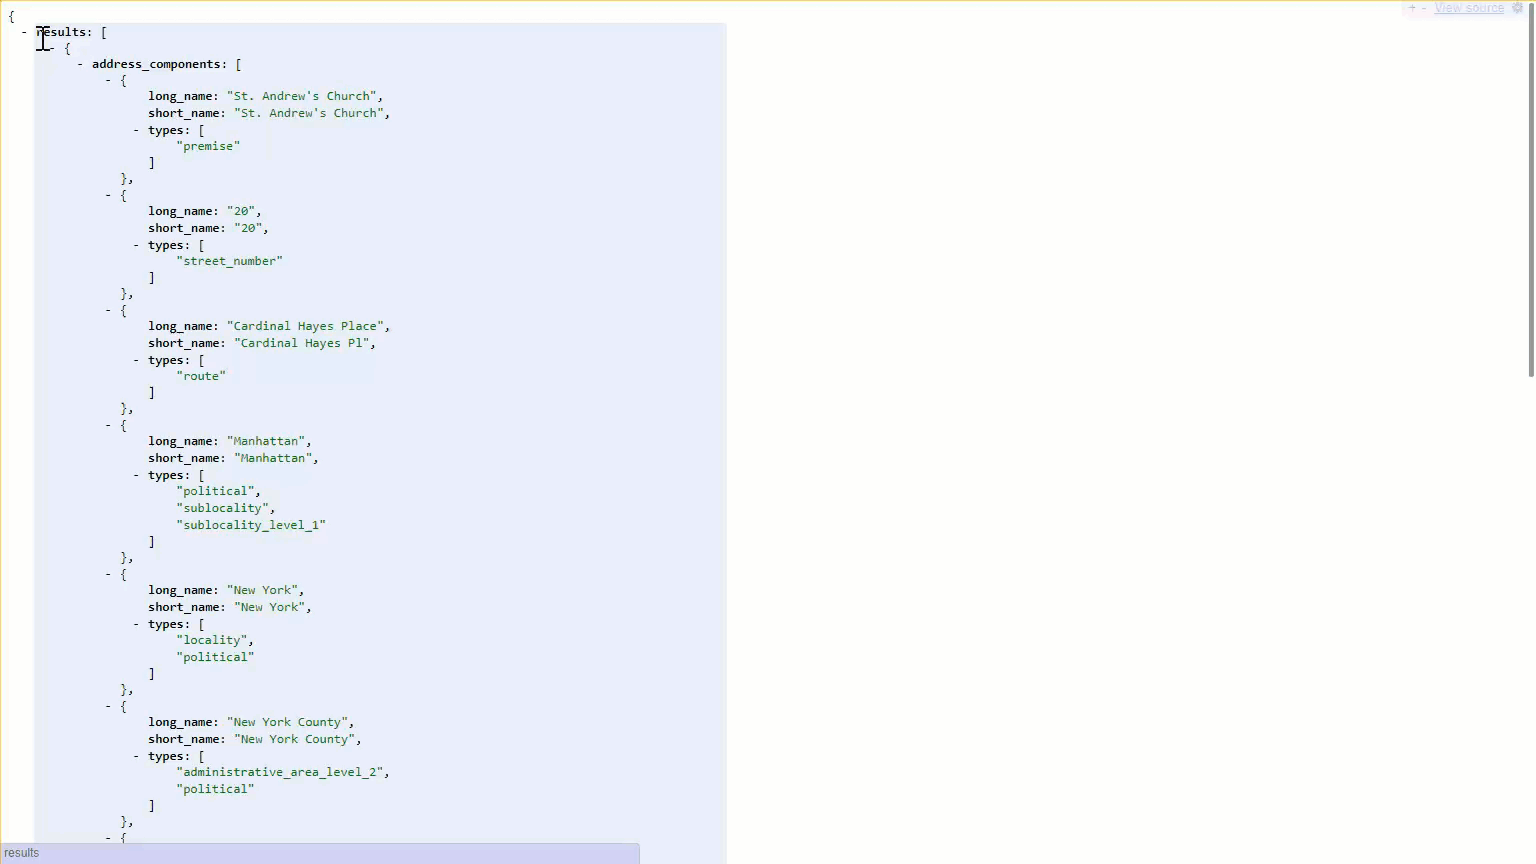
I started with static versions of old New York AA Meeting List Agenda webpages saved by our professor and re-published for our course
I then used the web inspector to find any organizational structures and patterns in the code within these messy, outdated pages...
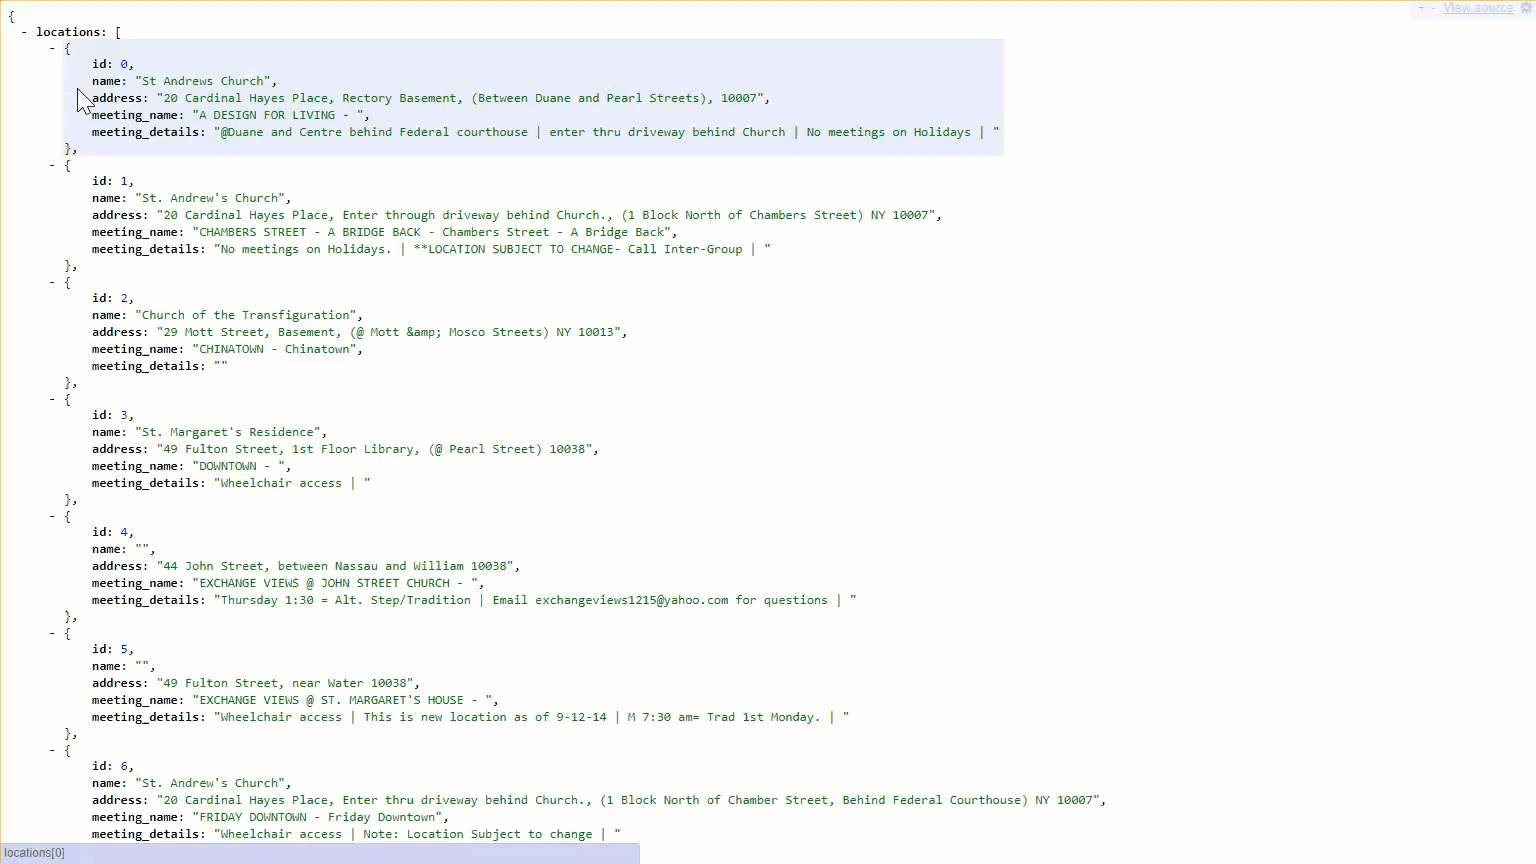
...and used node to pull down the raw HTML for each page and parse location and event data from these files into workable JSON formats
I used Google's Geocoding API to find the the latitude / longitude for each location identified across all 10 raw data files, along with a cleanly formatted address
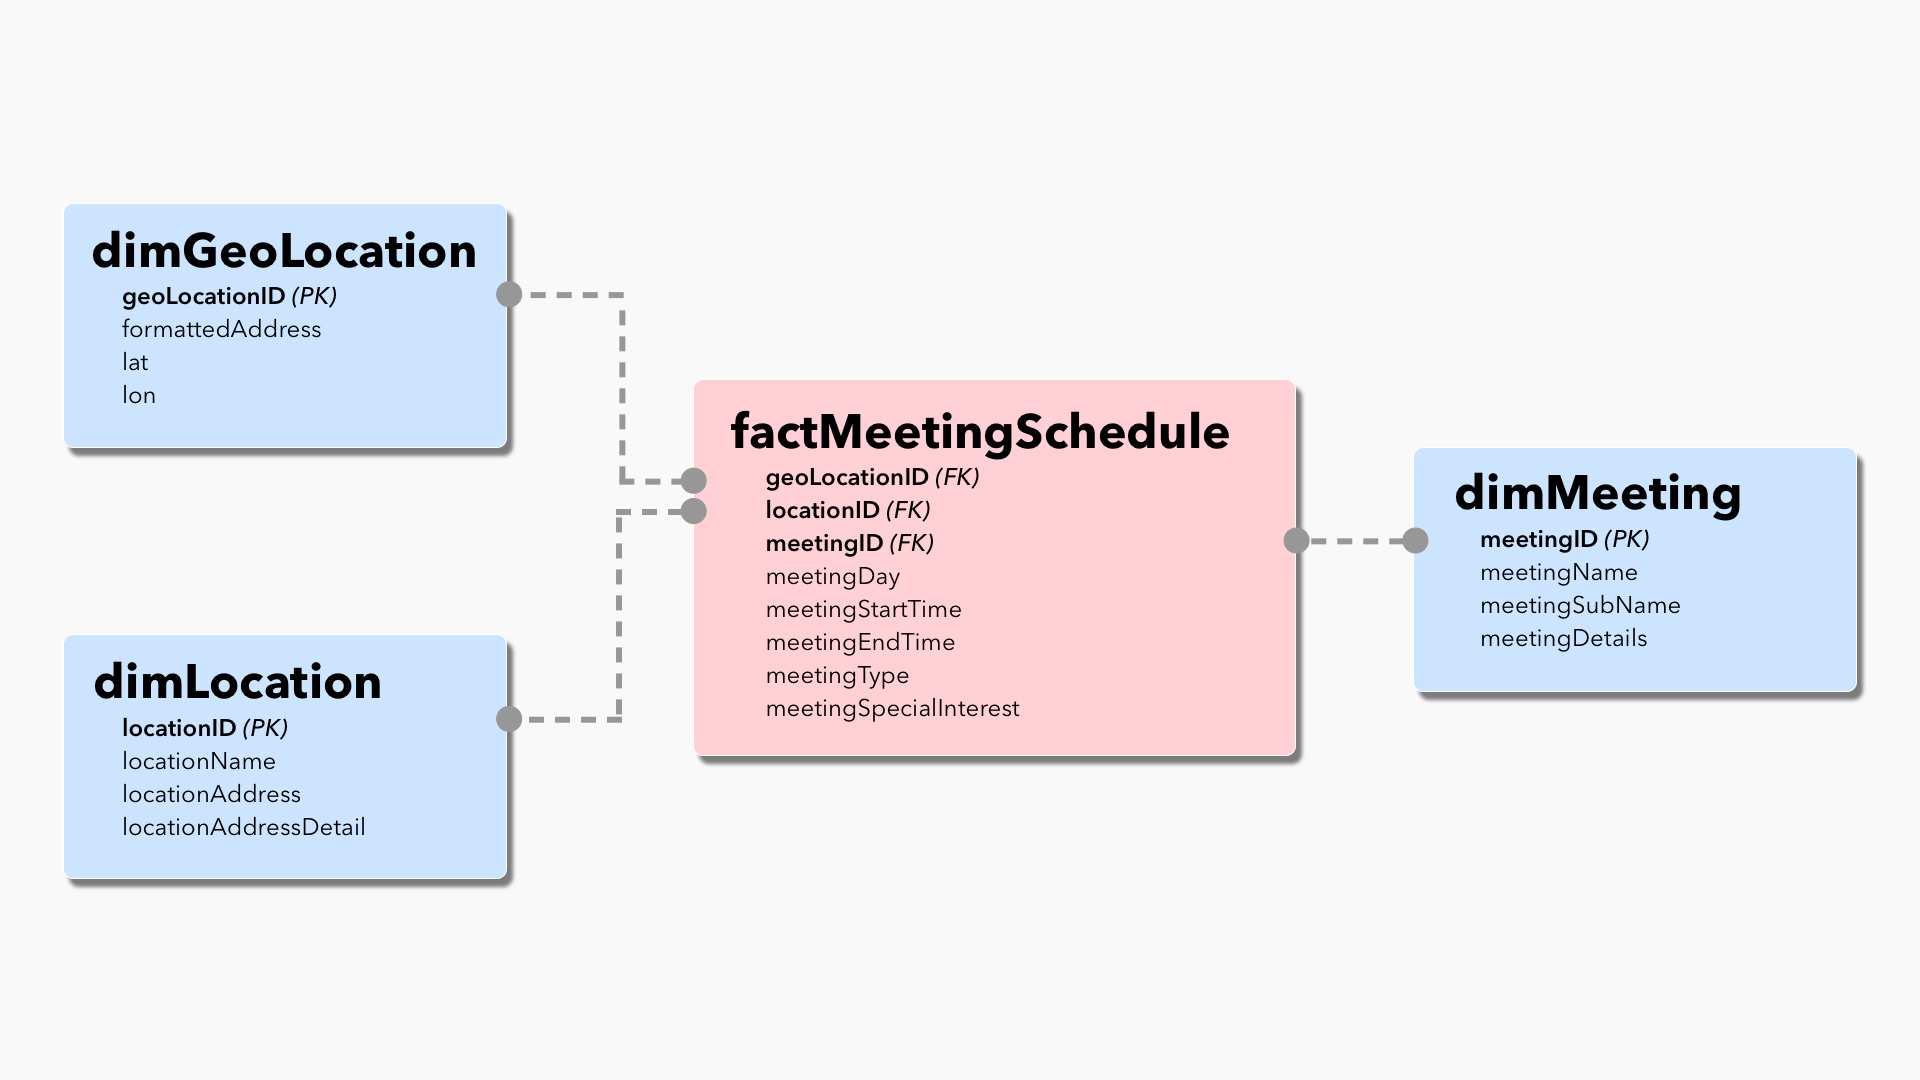
Finally, I combined location, event, and meeting schedule data with the geographic data results from the Google to populate a custom data schema I designed for this project
Data Querying
The data query for my front-end interface pulls geolocation, location, meeting, and schedule data from my PostgreSQL data structure for any meeting within a certain amount of hours from now and a certain distance from a specific location (defaulted to Parsons). These mile and distance values are passed into the query itself, ensuring we're querying the minimum amount of data needed to display only relevant meetings and locations.
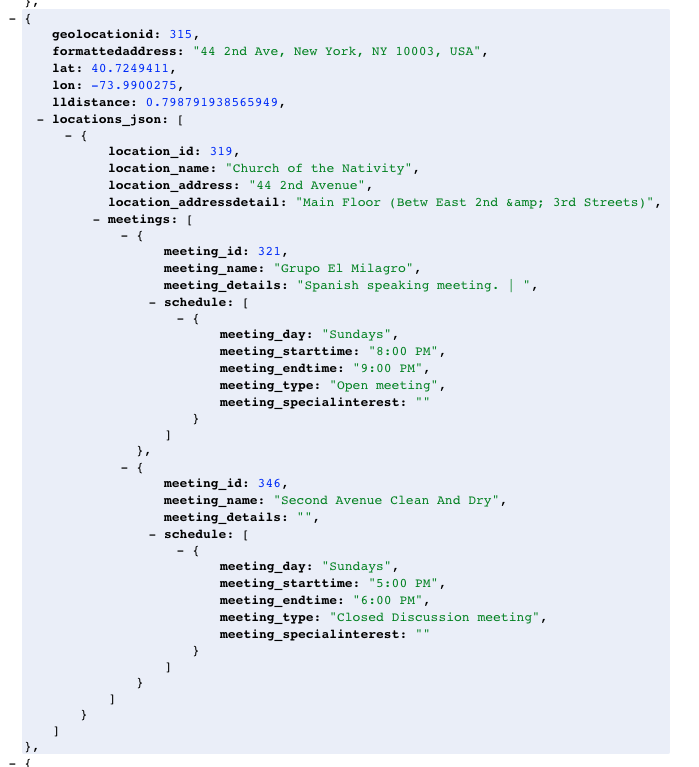
The query returns one row per geolocation that matches our location constraint with a nested structure containing information about each location within a geolocation, each meeting within that location, and the schedule within each meeting that matches our time constraint:
Visualization
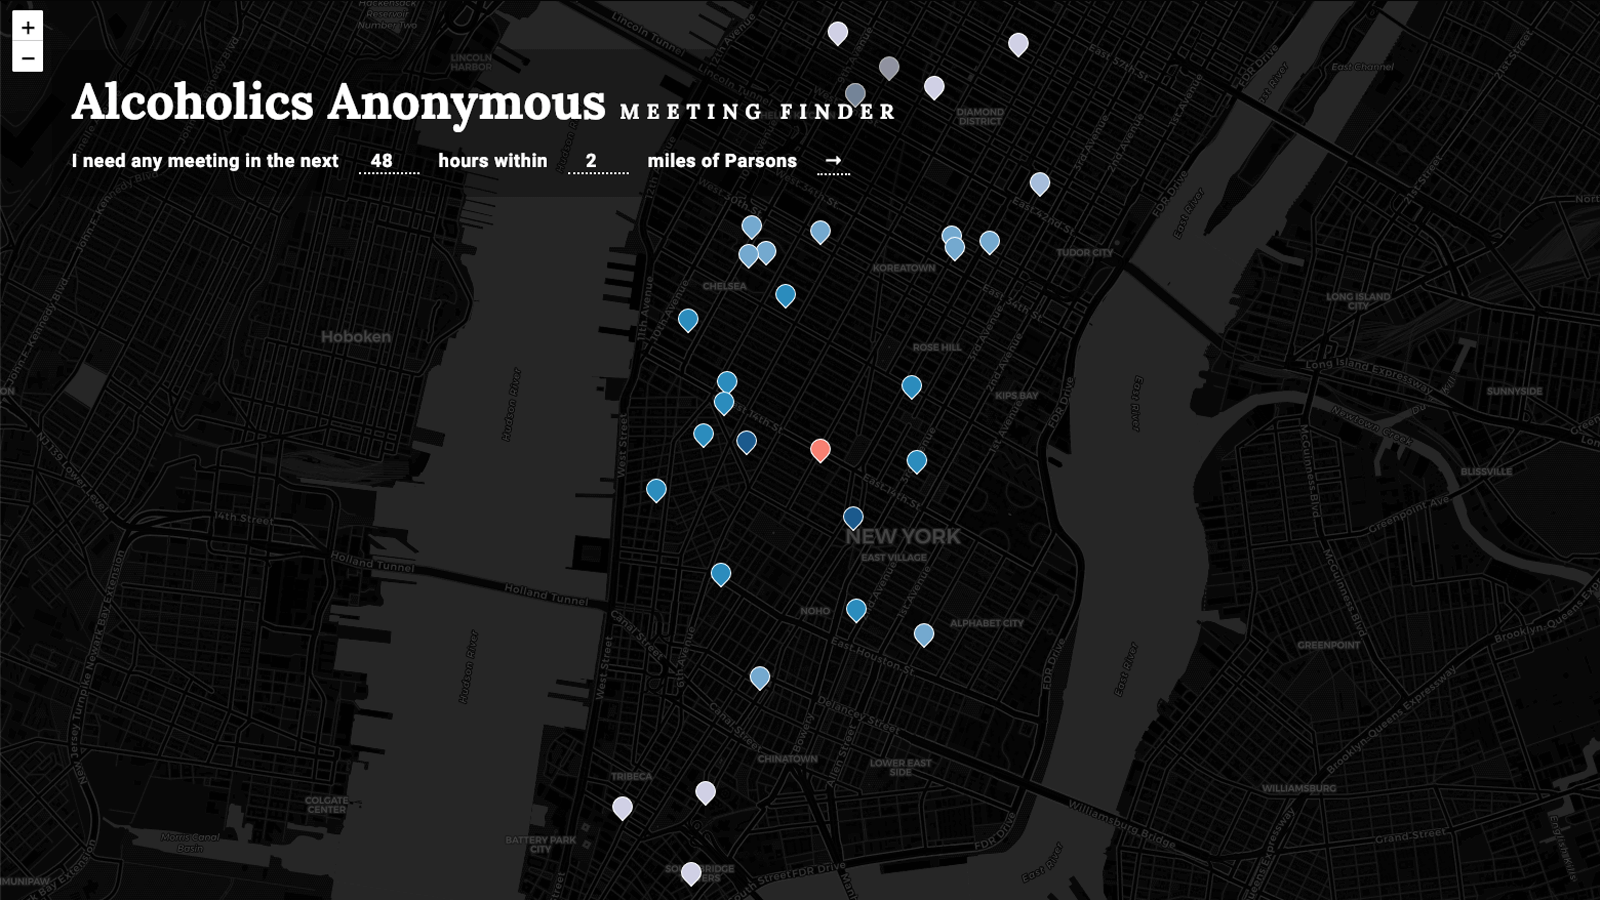
Our main visualization is a dark map with location markers. The dark map provides a sleek design that visually highlights locations flushed with color.
Each geolocation that has at least one meeting within the time and location constraints provided is mapped to an individual marker on the map. Our map's default view is centered around our current location (defaulted to The New School University Center), with a zoom level representative of the distance constraint provided.
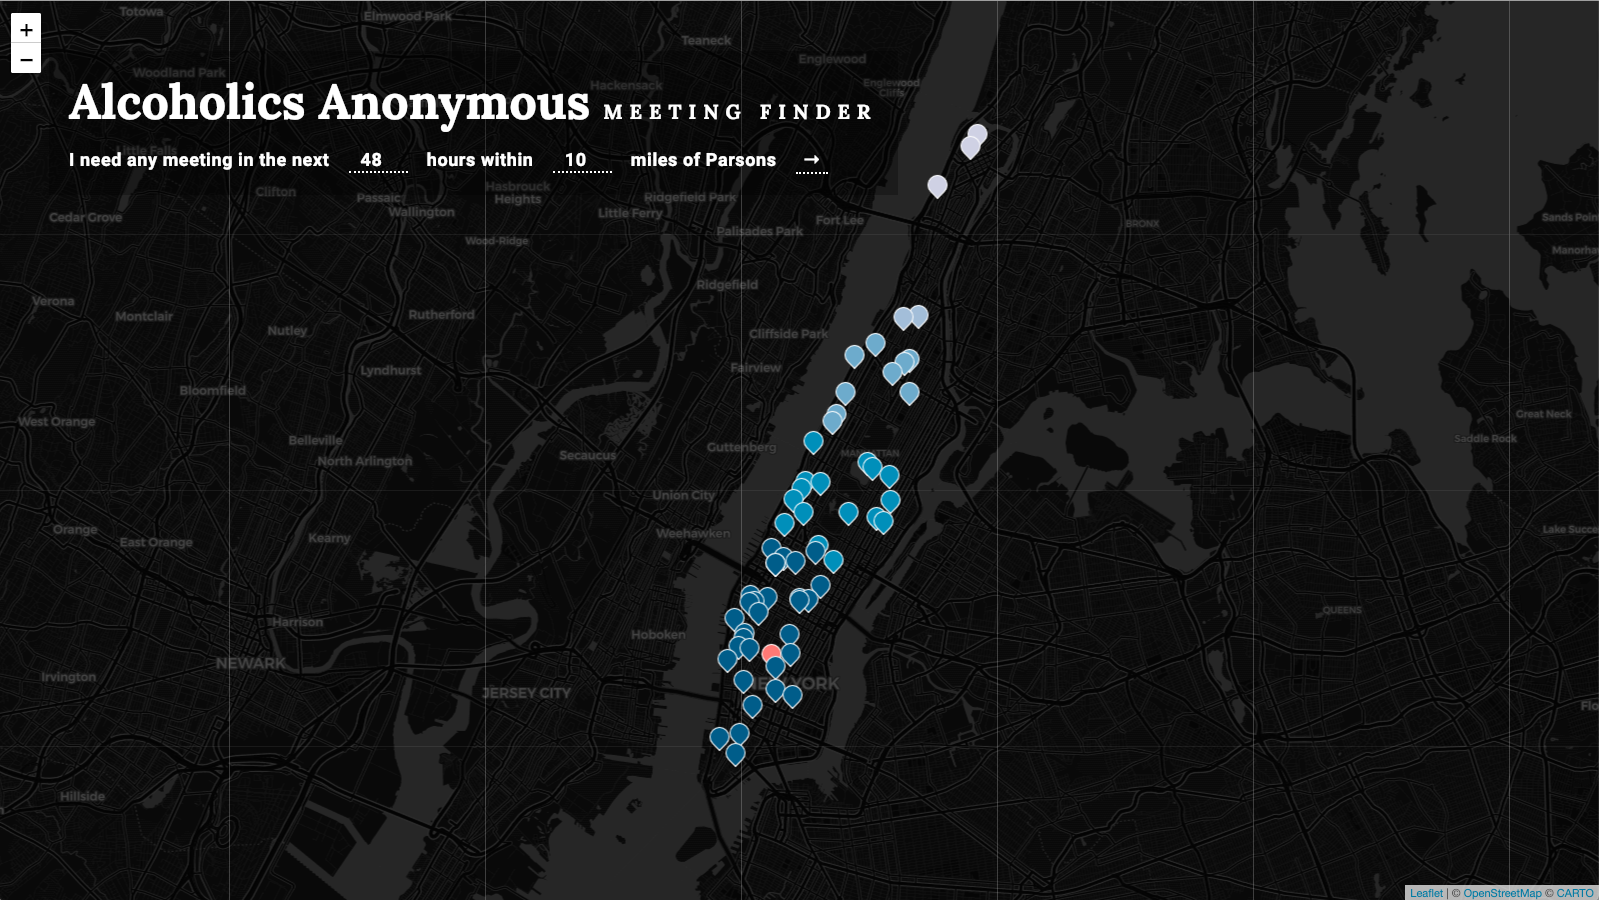
Location markers are colored in a gradient based on distance from the current location with darker colors representing closer meetings. Current location is shown in a constrasting red.
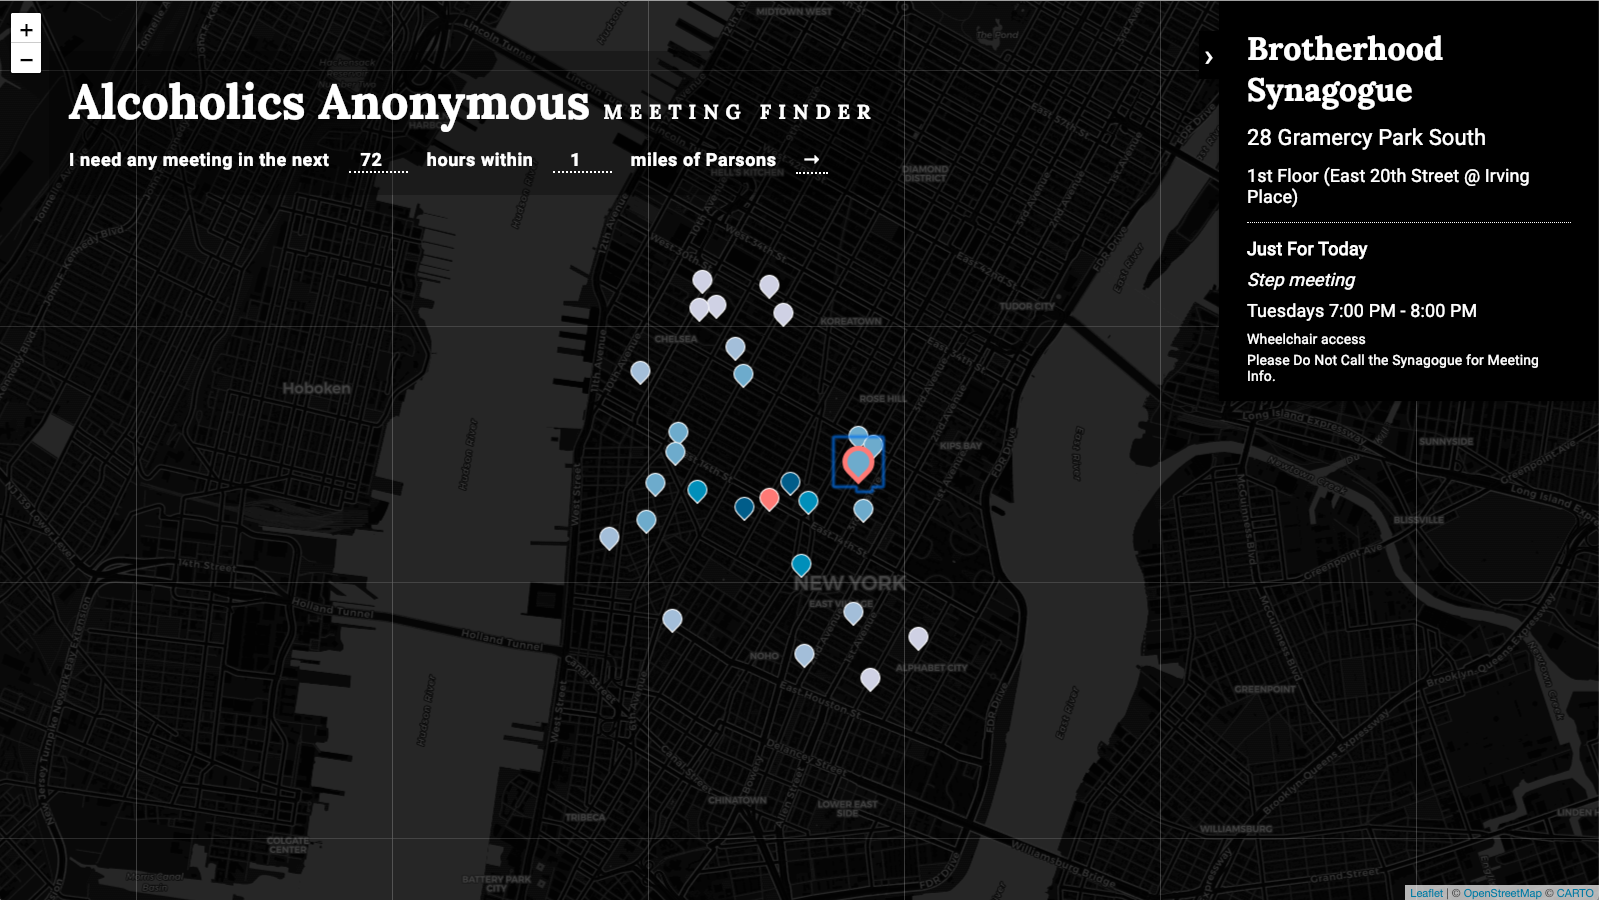
Hovering on a specific meeting geolocation changes our mouse to a pointer, prompting a click on that location. Information about the location(s), meeting(s), and schedule(s) at each meeting are then mapped to a pop-out which is accessible after that click, which will highlight the selected map marker and bring up a pop-out side pane that provides (in order of hierarchical presentation):
- Location name, address, and address details
- Meeting name, meeting type
- Meeting schedule within timeframe provided
- Additional meeting details, topics of interest, and accessibility concerns (if present)
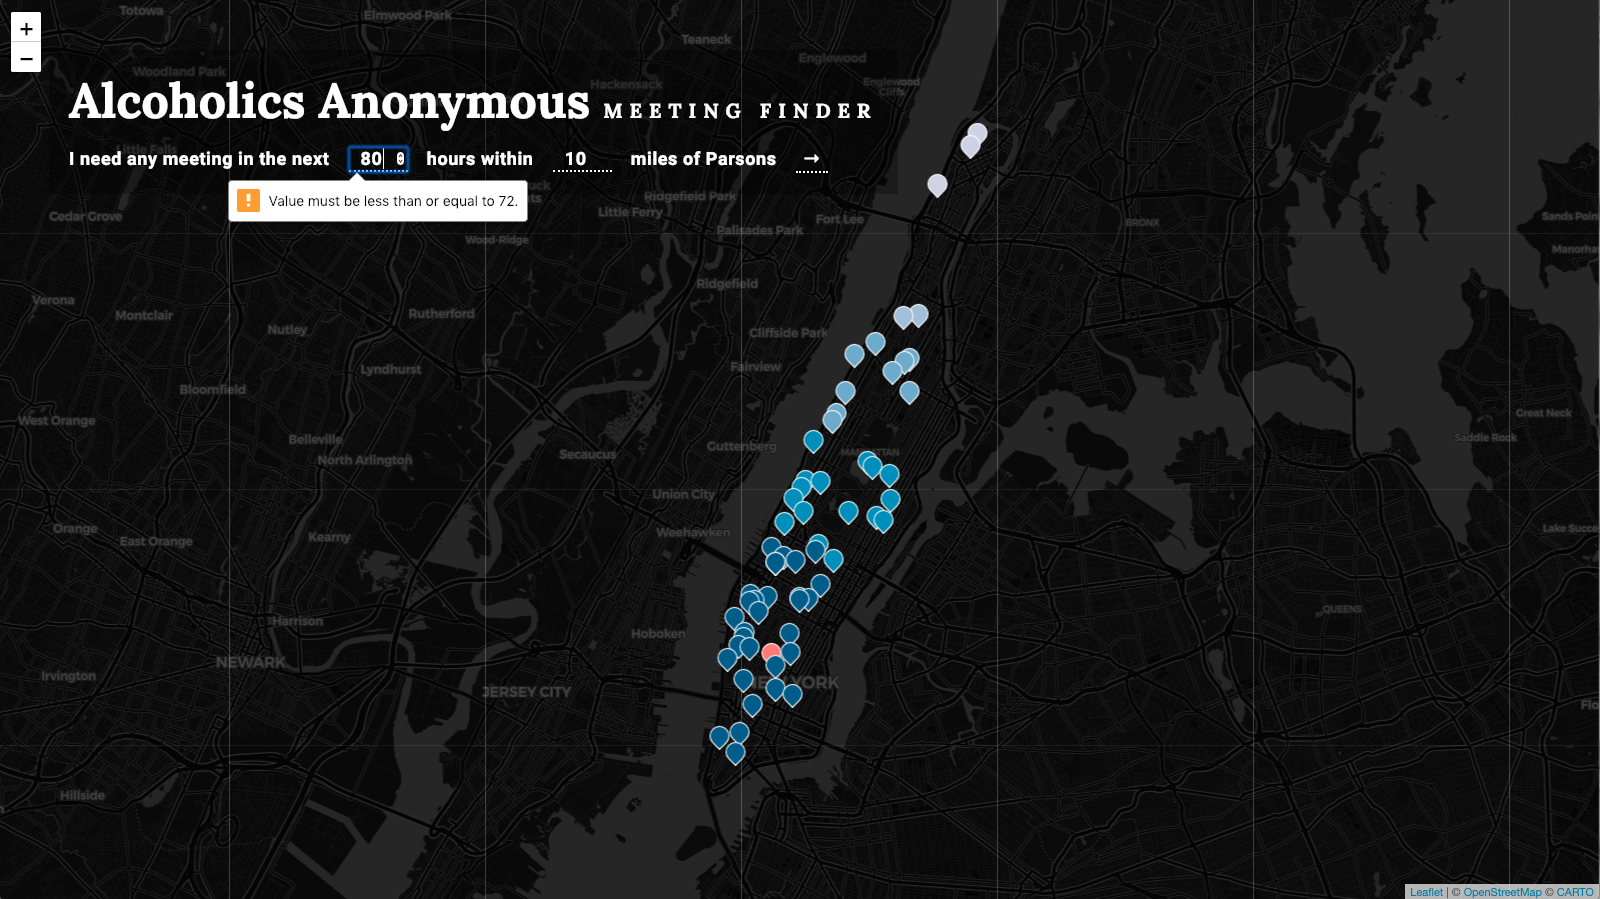
The top-left menu provides users the opportunity to adjust the time and distance parameters and see the map update accordingly — these values are defaulted to 48 hours from now and 2 miles from The New School. Users can enter values up to 72 hours and 10 miles — values outside this range prompt a pop-up error with pointed guidance.