Diary Of Envy
This web app catalogs some of my favorite data visualizations and portfolios in a blog-style interface.
Process
Audience: Parsons Data Structures Course
Data Source: Personal NoSQL AWS Database
Tools: AWS DynamoDB / CSS / Express / Handlebars / HTML / JavaScript / Node / NoSQL
Data
I designed a semi-structured NoSQL document-based data model that utilized the flexibilty of nesting within the JSON format. This design allowed each entry to include (or not include) a range of information on each diary entry that weren't appropriate for a SQL database, including a range of data types (including text strings, lists, and dictionaries) and media elements (including images, videos, or links to social media posts about a particular piece). I then used node to realize this data model in AWS DynamoDB and add entries to this data structure on a semi-regular basis.
I structured this DynamoDB database with project category serving as my partition key and date added to the diary serving as my sort key. My database query that loads data to the front-end visualization therefore pulls in projects that match the current project category selection (defaulted to interactive visualization) that were added on or before October 1, 2018 (when this project started – no entries were added before this date). When a user changes the product category they want to see, the page is re-rendered and a new query is executed returning only those entries that match the category chosen.
Visualization
This project is designed to be a simple running list of entries with a broad overview of the specific entry in the same vein as similar pages from some of my favorite publications. My entries are split into three categories — interactive visualization, static visualization, and portfolio — and I present individual entries within one category at a time in reverse order of when I added them to this diary (meaning the newest additions to the list will come up first, then proceed in descending order).
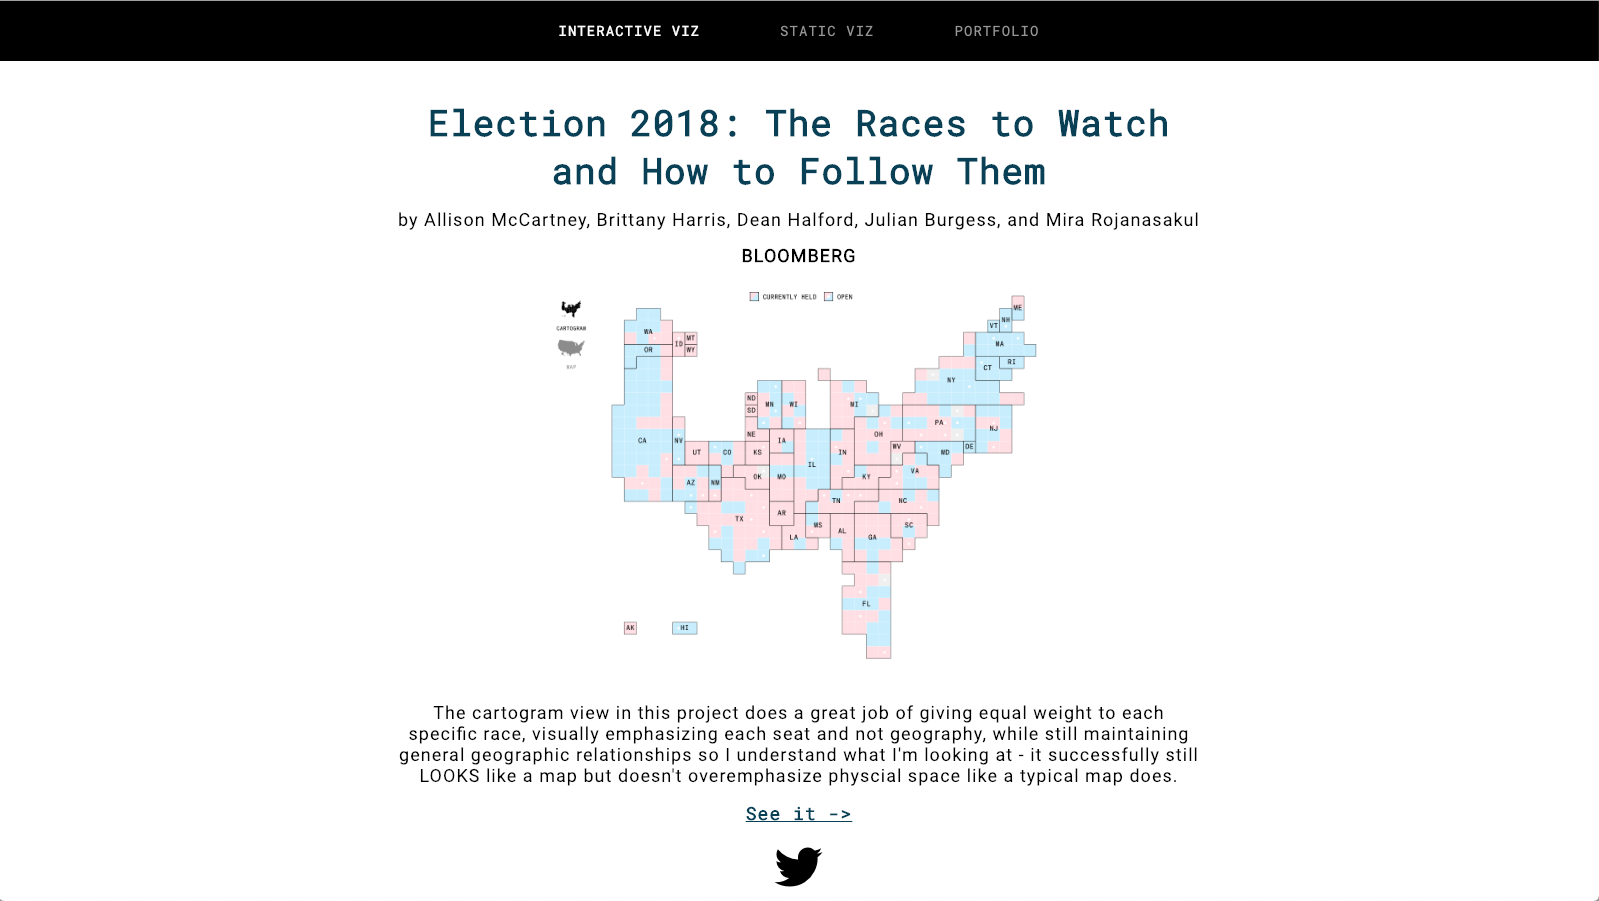
I render html elements for each of the following data points that is present for the the particular entry:
- Name of the project/portfolio
- Publication
- Author(s)
- Preview image/gif
- My general thoughts (why I included this specific item)
- External link to project/portfolio
- External link to twitter from the author or publication
Each of these data points is represented in a visual hierarchy that reflects their level of importance to that entry – the title of the piece is most visually distinguished from the remaining text, while the project preview image occupies the most screen space. The external link to the project is emphasized by matching the typeface and color of the project title, while the publication name is given slightly more weight than the authors (but listed after these individual names).
~~Client Work~~
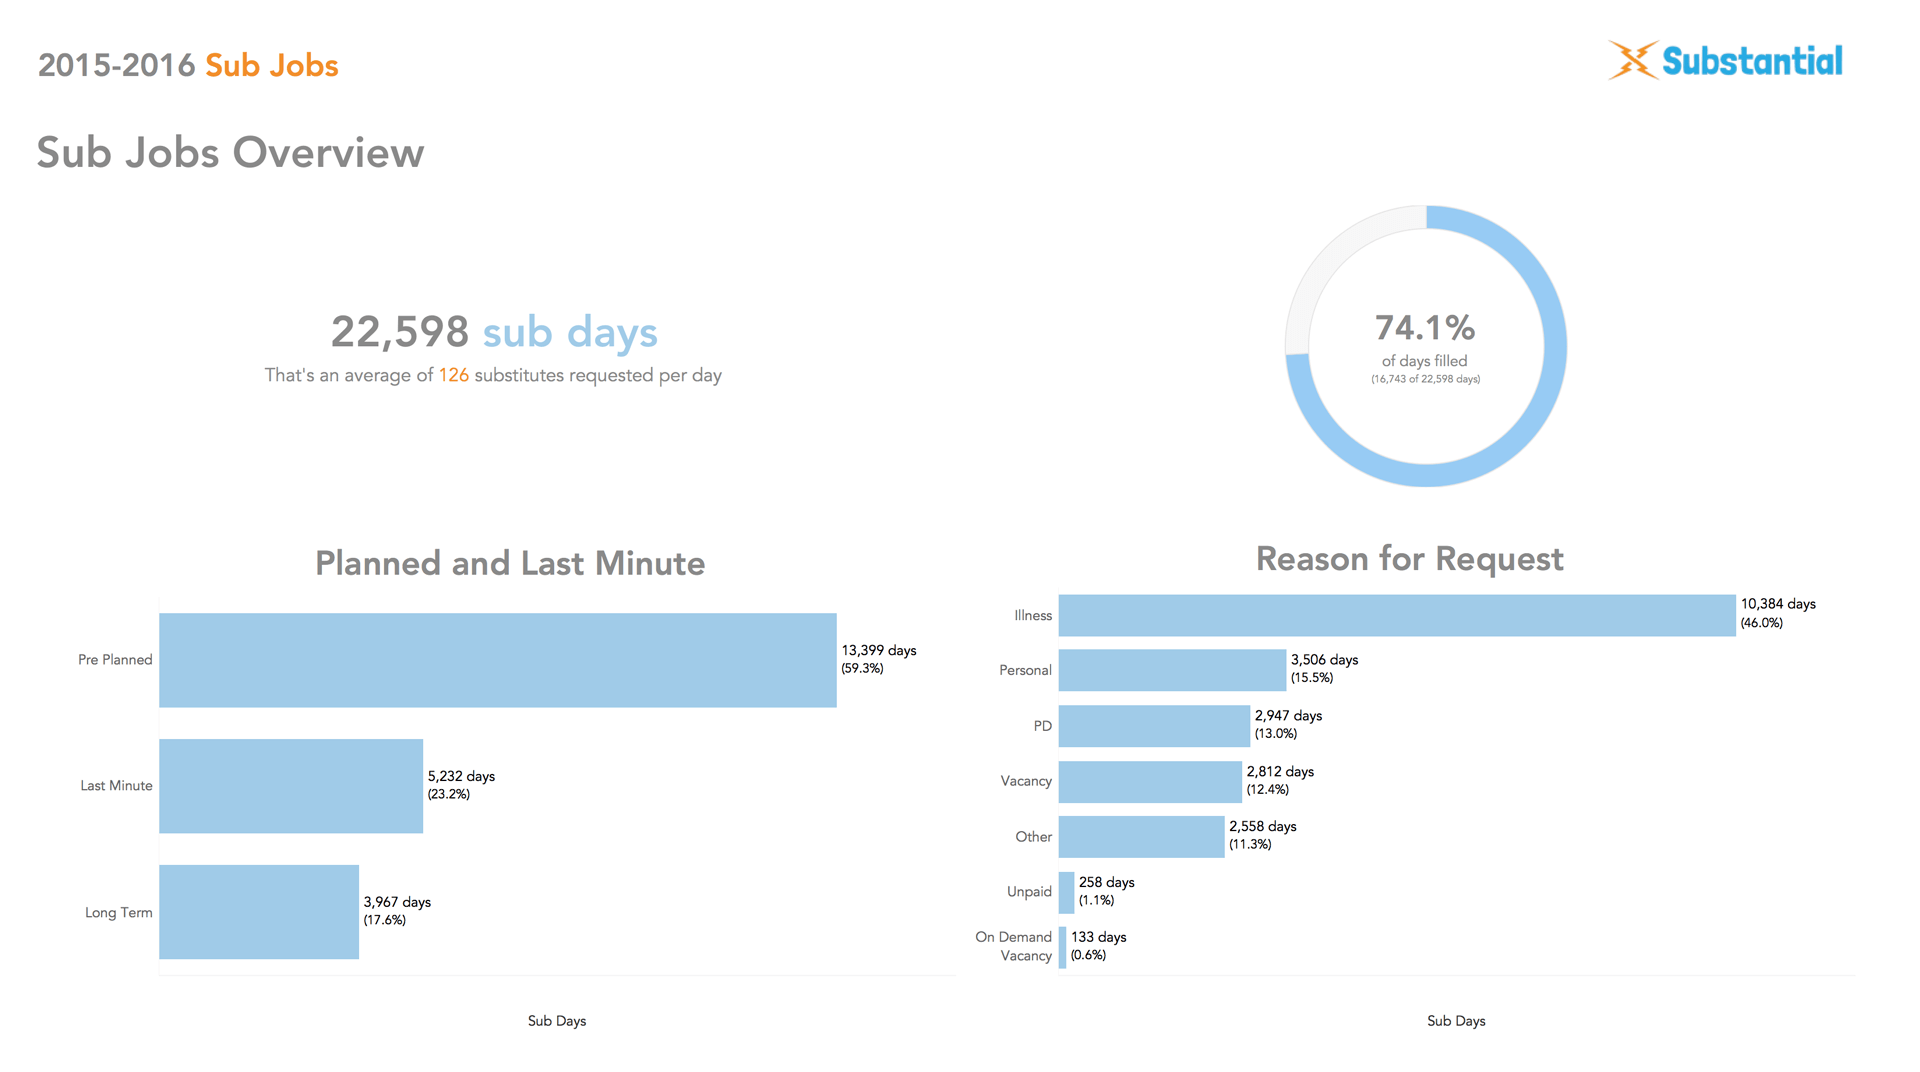
Sub Data Dashboards
Like this project? Want to get in touch? Reach out!