Drawing Discrimination
This visualization explores redlining’s lasting impact on homeownership, home equity, and wealth building opportunities across New York City
During the mid to late-1930's, the federal goverment commissioned maps of American cities that rated individual neighborhoods on the riskiness of a real estate investment in those communities. These maps would help determine who could get a mortgage and where properties were deemed valuable for decades to come. In a process that later became known as 'redlining', appraisers primarily used race to determine how valuable or risky housing was in a neighborhood — non-white or immigrant communities were officially treated as 'hazardous' influences to real estate value.
For my thesis project as a student in the Data Visualzation MS program at the Parsons School of Design, I explored how housing discrimination shaped who was able to build wealth in housing in the past century. To do this, I tracked changes in the racial composition and real estate markets of neighborhoods within New York City redlining maps in the decades after they were drawn. I then looked at individual neighborhood case studies of communities with similar racial compositions or homeownership markets in 1940, connected these communities to the redlining gradings they received at that time, and followed their changing and diverging housing markets through 2010. I also open up the map for exploration, allowing users to study the redlining map of New York in more detail or investigate potential threads of housing discrimination themselves.
Process
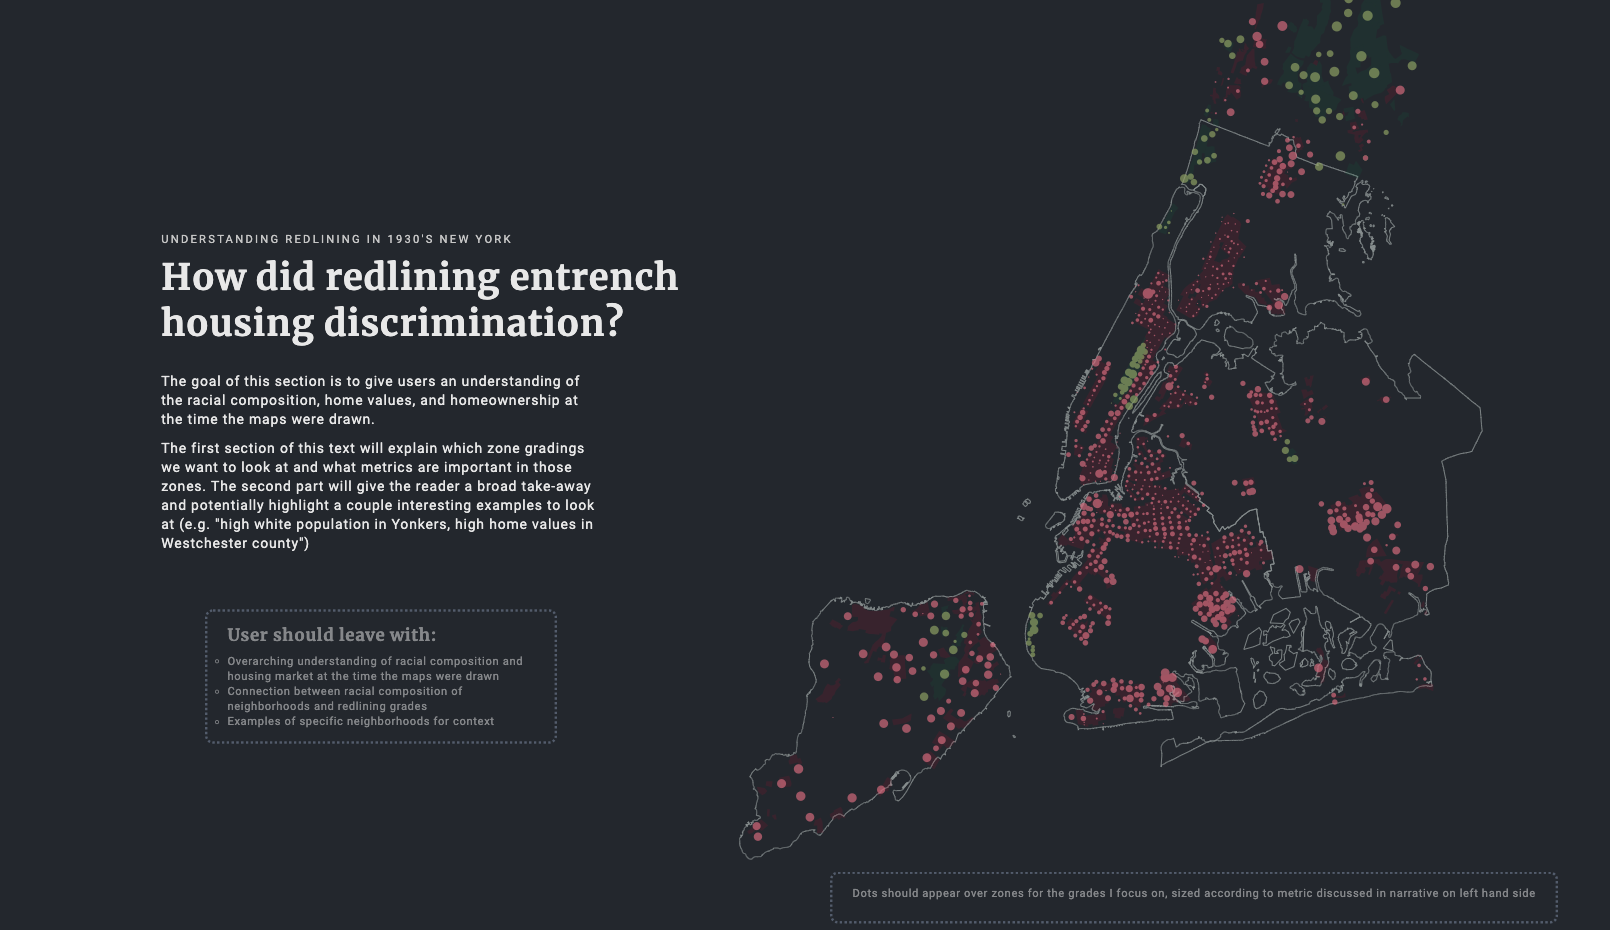
My first wireframe mock-up for this project expanded on my NYC Redlining Poster project, introducing redlining through maps with individual neighborhoods represented as dots...
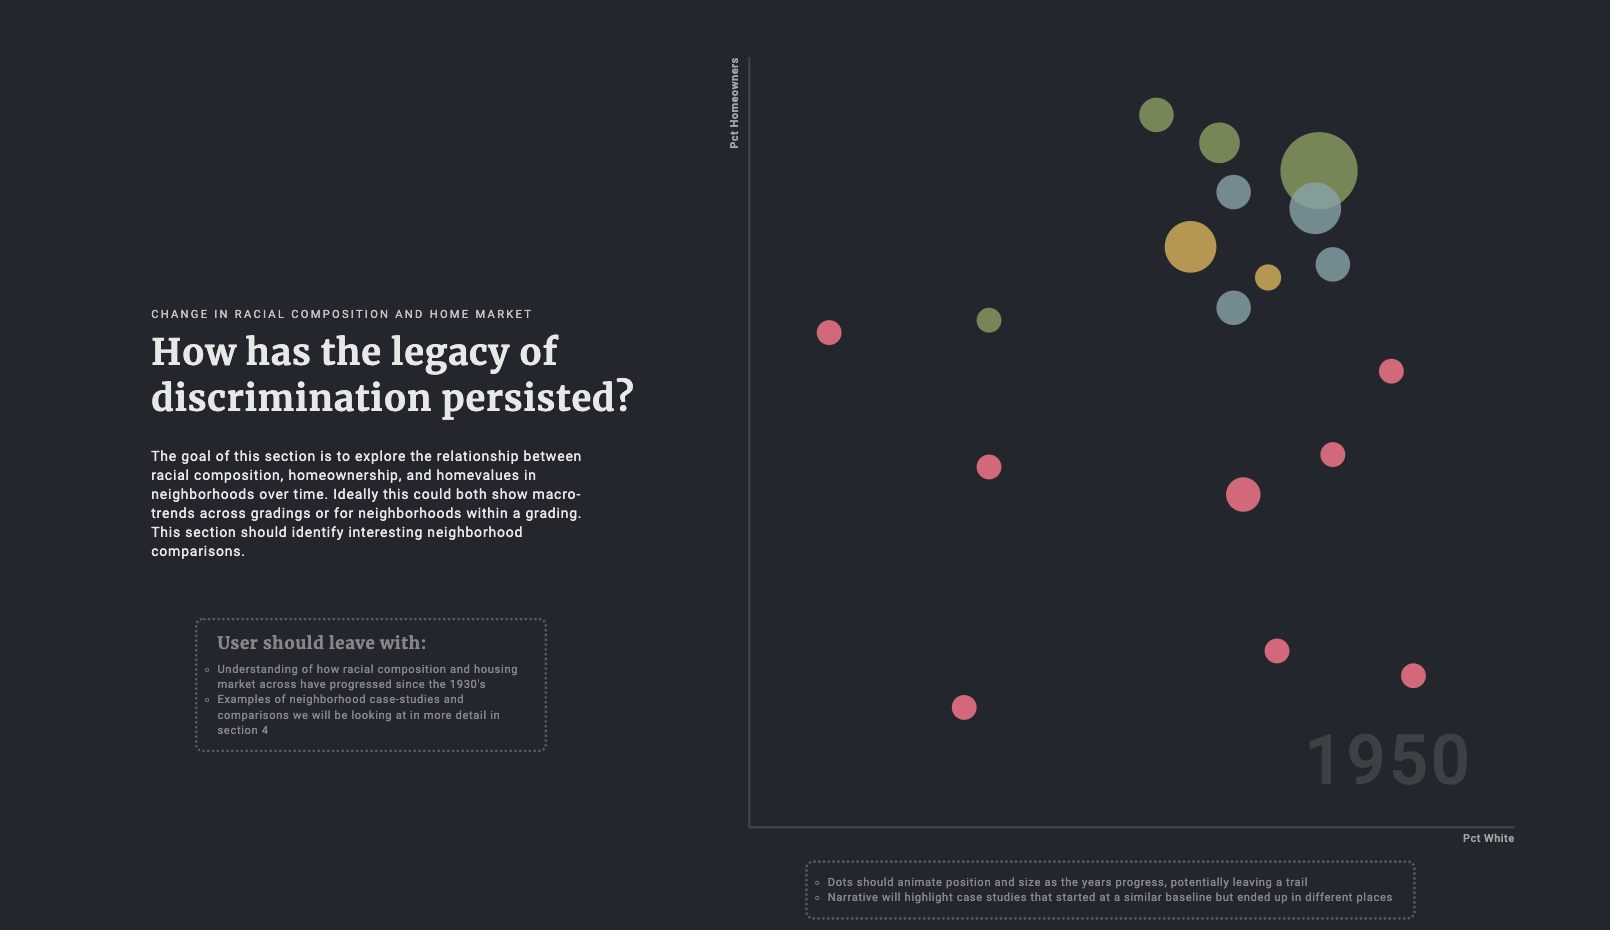
...which I would then bring off the map into a Gap Minder inspired scatterplot that displayed insights for the racial composition, homeownership, and home value across the city as a whole.
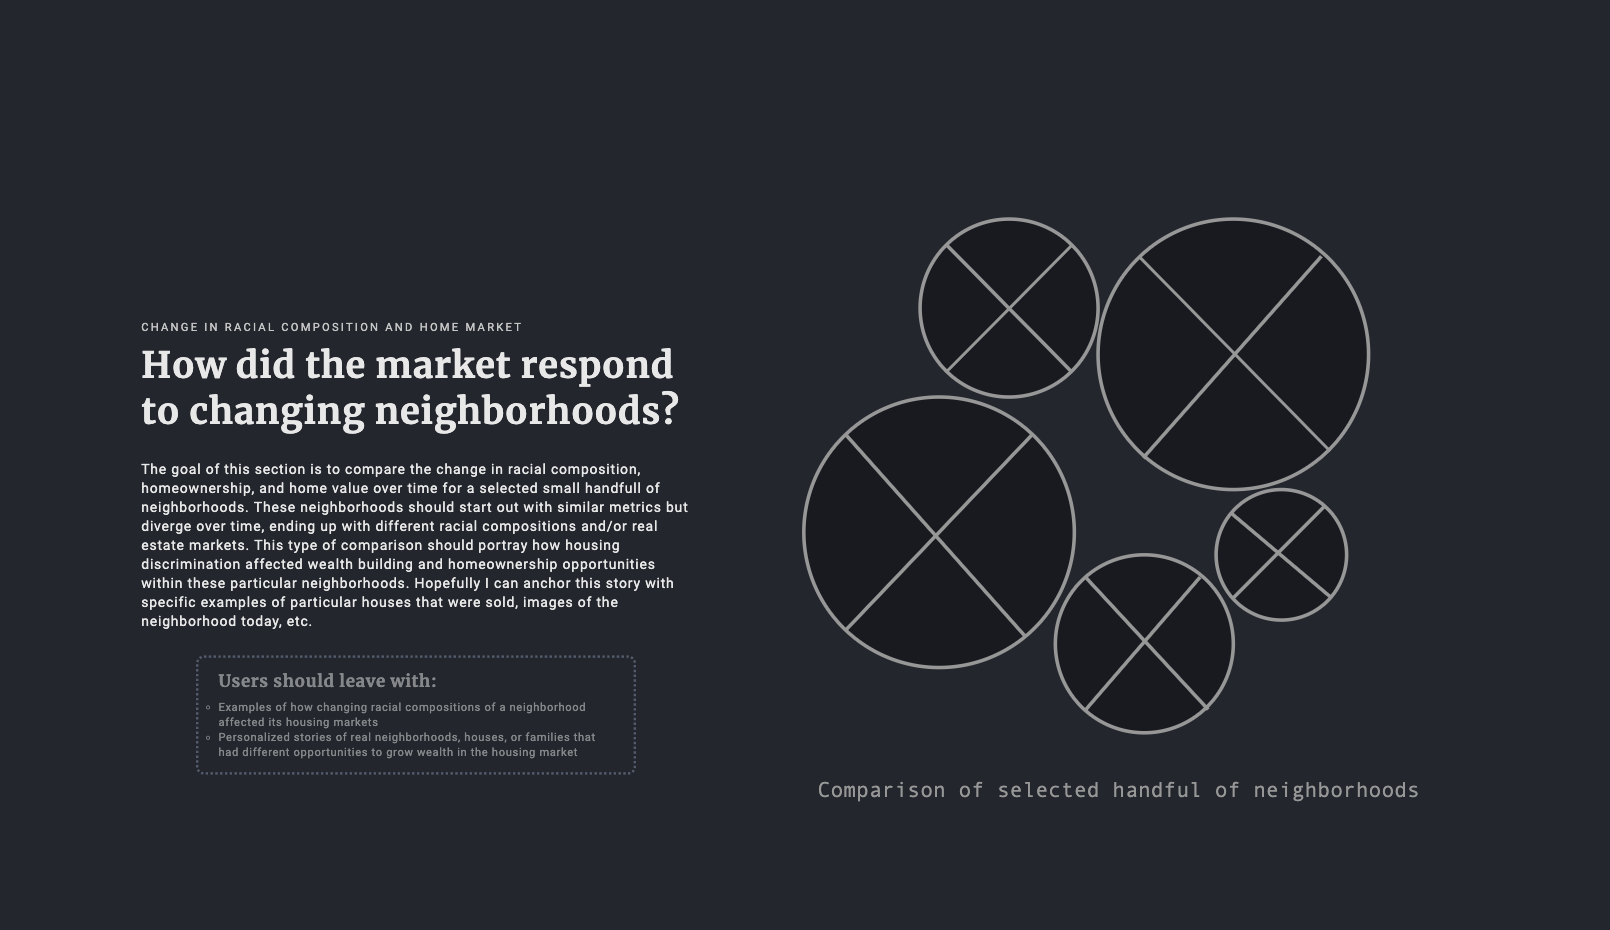
I then wanted to show individual neighborhood comparisons without any geospatial representation, showing how the housing markets and racial compositions progressed over time.
I decided to keep the map alongside neighborhood comparisons in my next wireframe – I found myself really wanting to see the map in any sketches or concept designs I did of these comparisons.
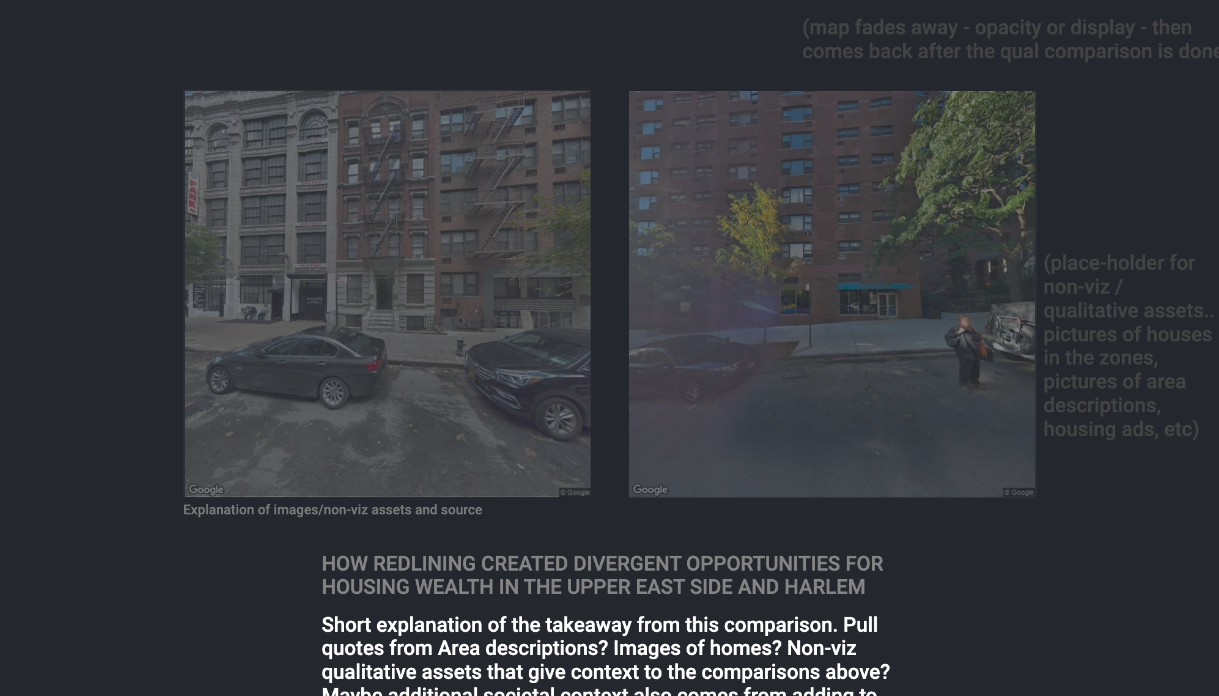
I also wanted to add some qualitative assets that gave us a personal context – I ended up going with photos of individual buildings in each neighborhood over time while keeping the map in the view.
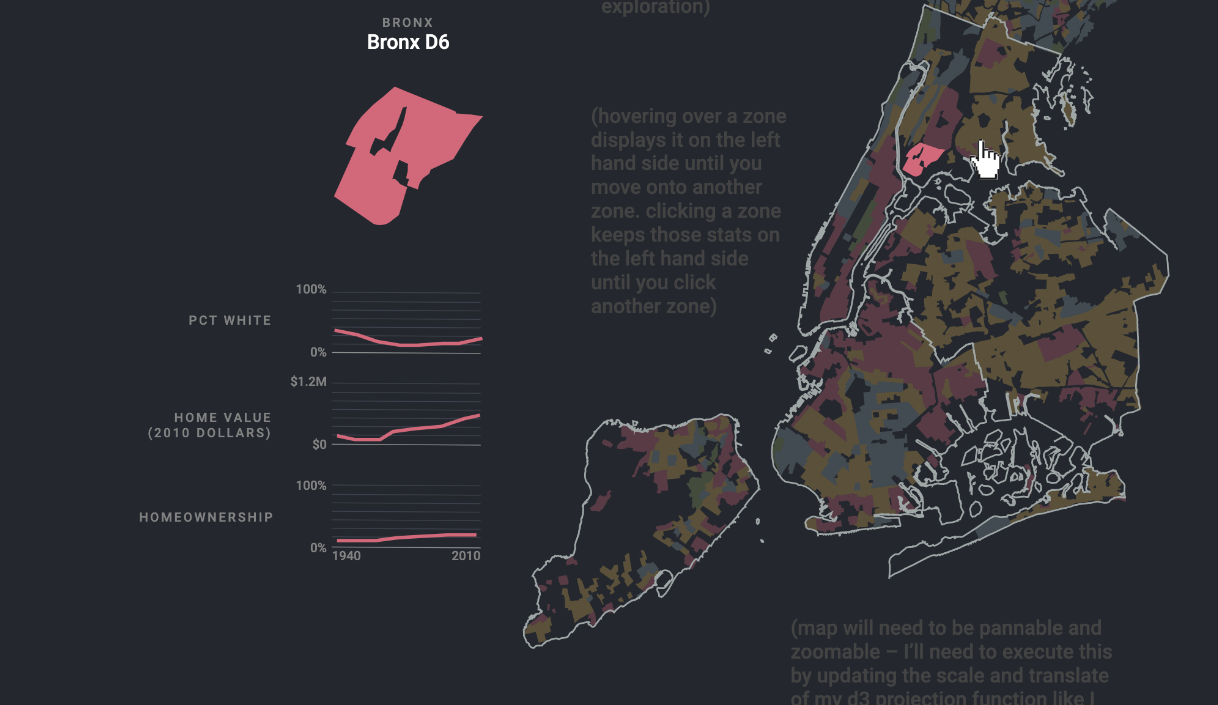
I also knew I needed a way for users themselves to explore the map, allowing them to pan, zoom, and see census results for individual neighborhoods they cared about.
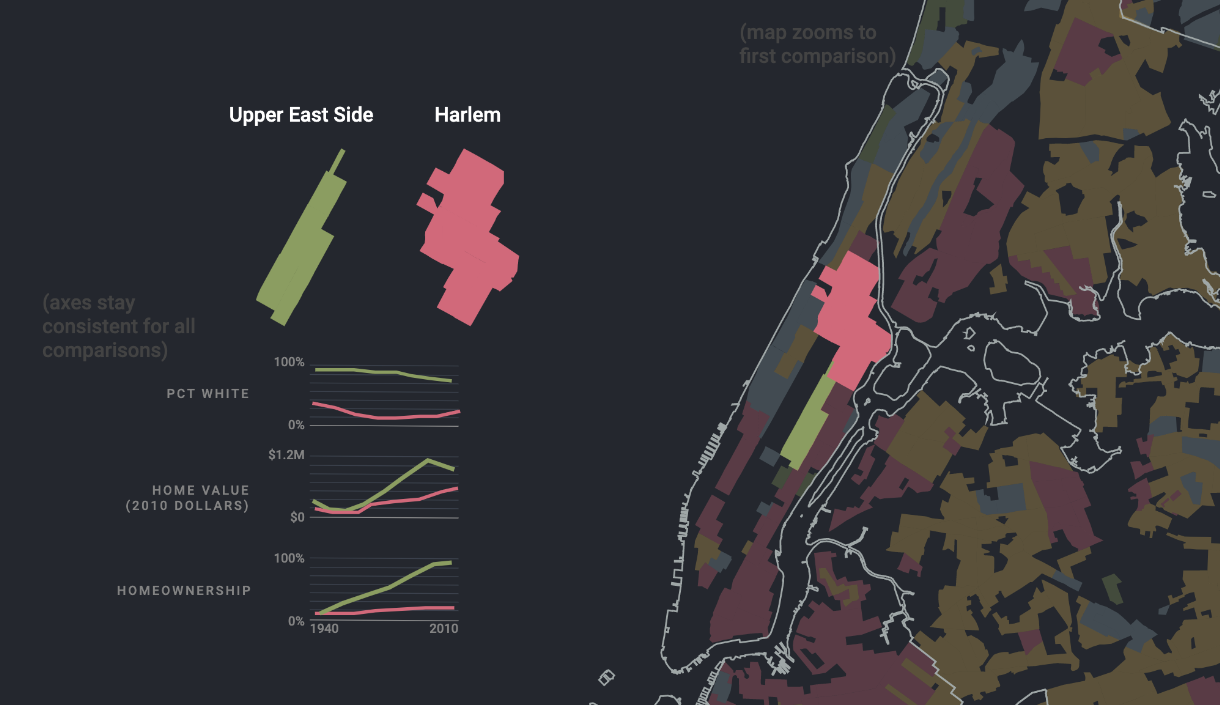
The final neighborhood comparison view ended up looking like a cleaned-up version of my last wireframe sketch, with more screen space given to the spark lines and clearer emphasis on the map.
Data Source: Redlining maps from Mapping Inequality project / Census data from IPUMS NGHIS / Building images from NYC Municipal Archives and Google Street View Static API
Tools: CSS / d3 / HTML / JavaScript / JuxtaposeJS / Node / ogr2ogr / Pandas / Python / Scrollama / Shapely / Sketch
Data
There were two main data sources in this project: redlining maps from the Mapping Inequality project and 1940-2010 census data from IPUMS NGHIS. I downloaded redlining maps in GeoJSON format for all five New York boroughs and lower Westchester county, which included boundaries and redlining grades for each neighborhood in that map. I then pulled census tracts (as shapefiles) and metrics (as csv files) on percent white/non-white, homeownership rates, and median home values for census tracts within New York from 1940 to 2010.
The biggest data challenge in this project was joining census tract data to redlining neighborhoods. These are two distinct geographic boundaries, with census tracts changing decade to decade. Ultimately, what I needed for this analysis was census estimates of racial compisition, homeownership rates, and median home value metrics for each redlining neighborhood in every census decade.
I approached this problem using spatial geomoetric analysis, leveraging the Shapely python library. I used this library to figure out which census tract boundaries intersected each redlining neighborhood, logging the geographic area of the overlap. I then estimated census metrics for each neighborhood by averaging results across the tracts that intersected with that neighborhood, with each tract weighted by the proportion of the neighborhood it covers.
After this lengthy and complicated process, I exported a GeoJSON file with census estimates for each redlining neighborhood for every decade from 1940 to 2010, along with all the information originally included from the Mapping Inequality project: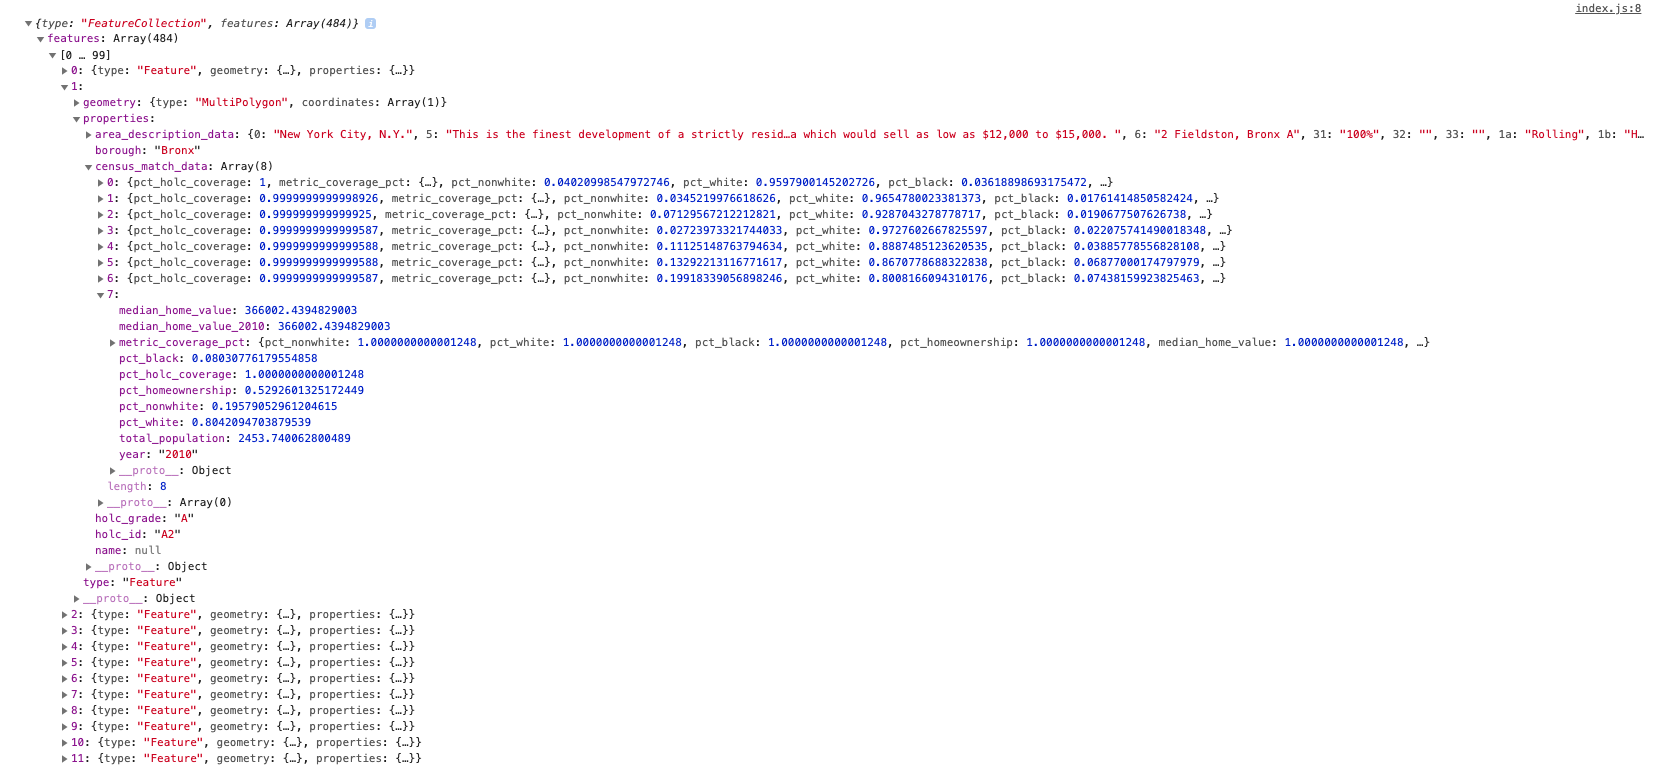
For more detail on this data and methodology, feel free to look at the Data and Methodology section of the full thesis write-up for this project.
Visualization
The visualizations for this project had two main contexts: geographic, showing the redlining map, and abstract, showing sparklines for census metrics over time. These two visual contexts needed to compliment each other to give the user the full picture of what these maps looked like and how housing markets progressed in these neighborhoods without being overwhelming.
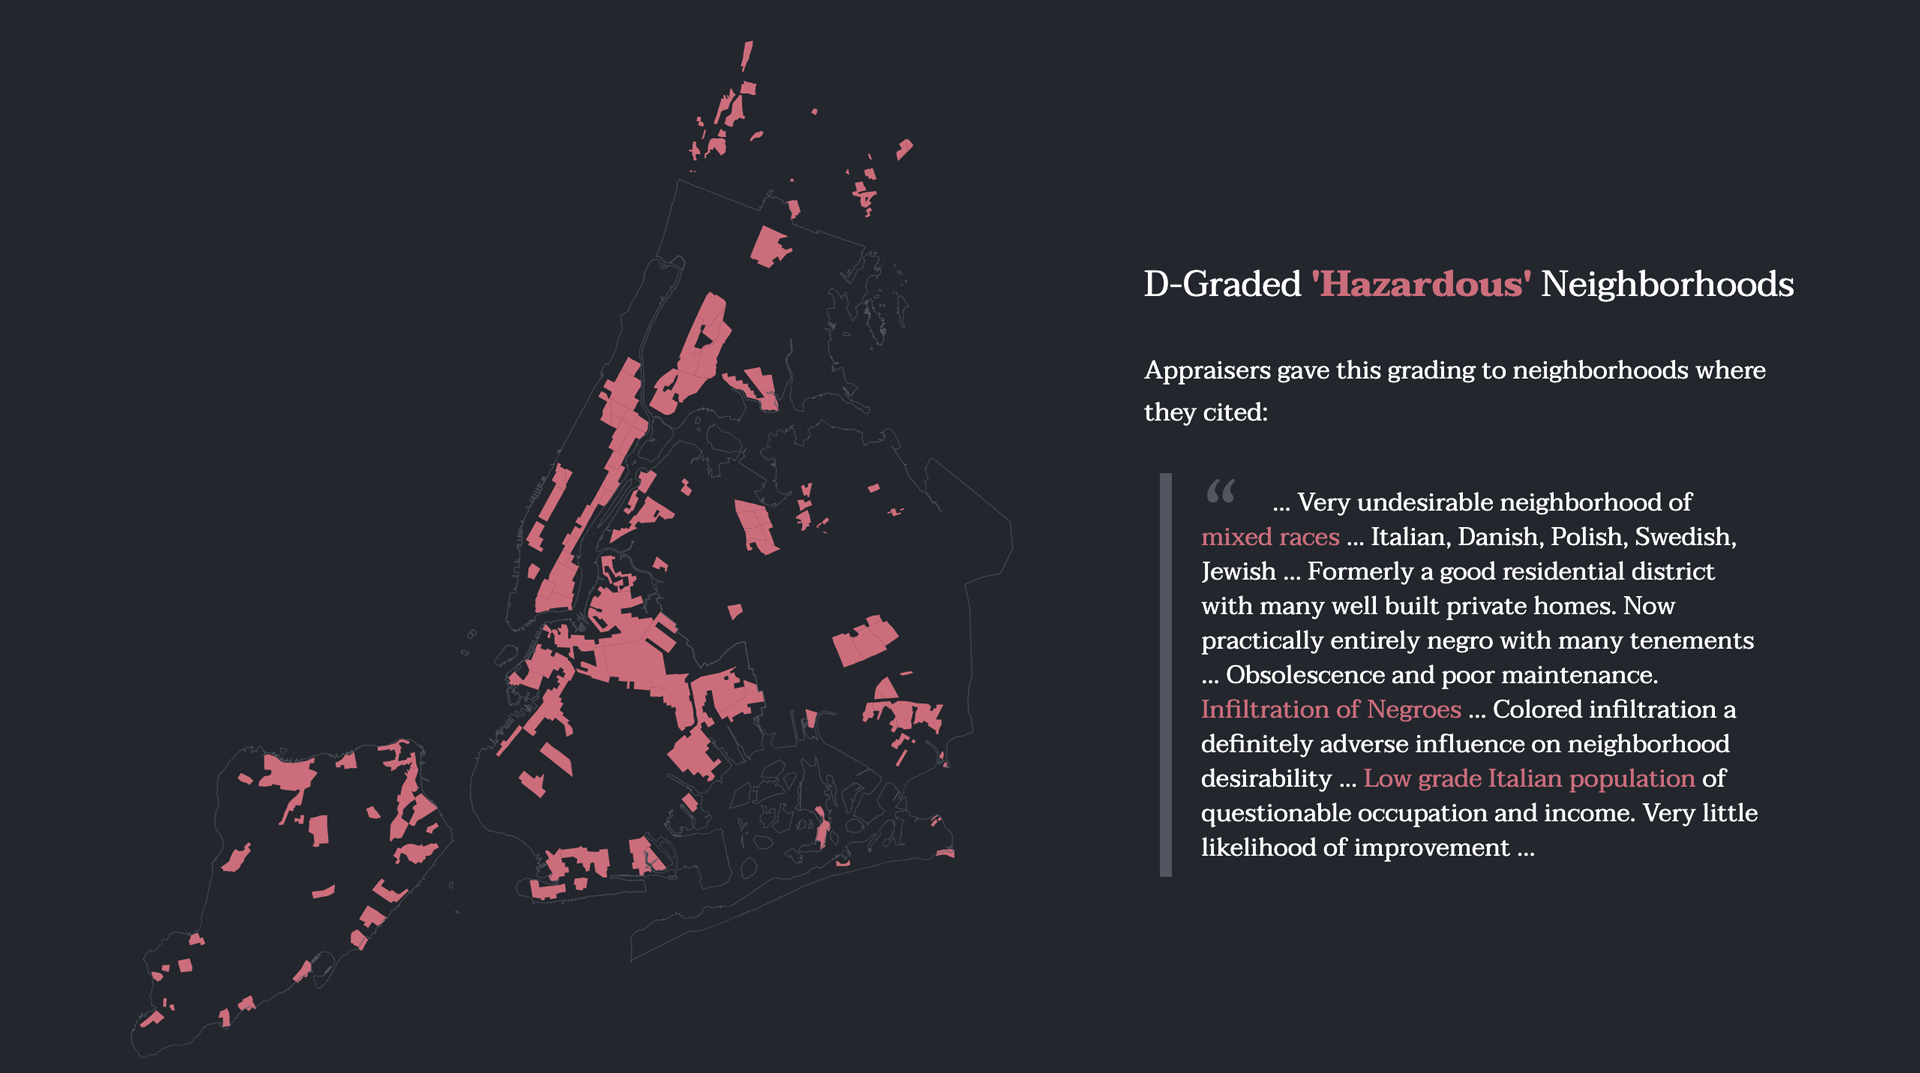
The first priority was orienting users to the map of New York, explaining what each grade represented using example quotes from the appraisers themselves. This serves to establish the color palette that will be used throughout the project and establishing an explicit meaning to those colors.
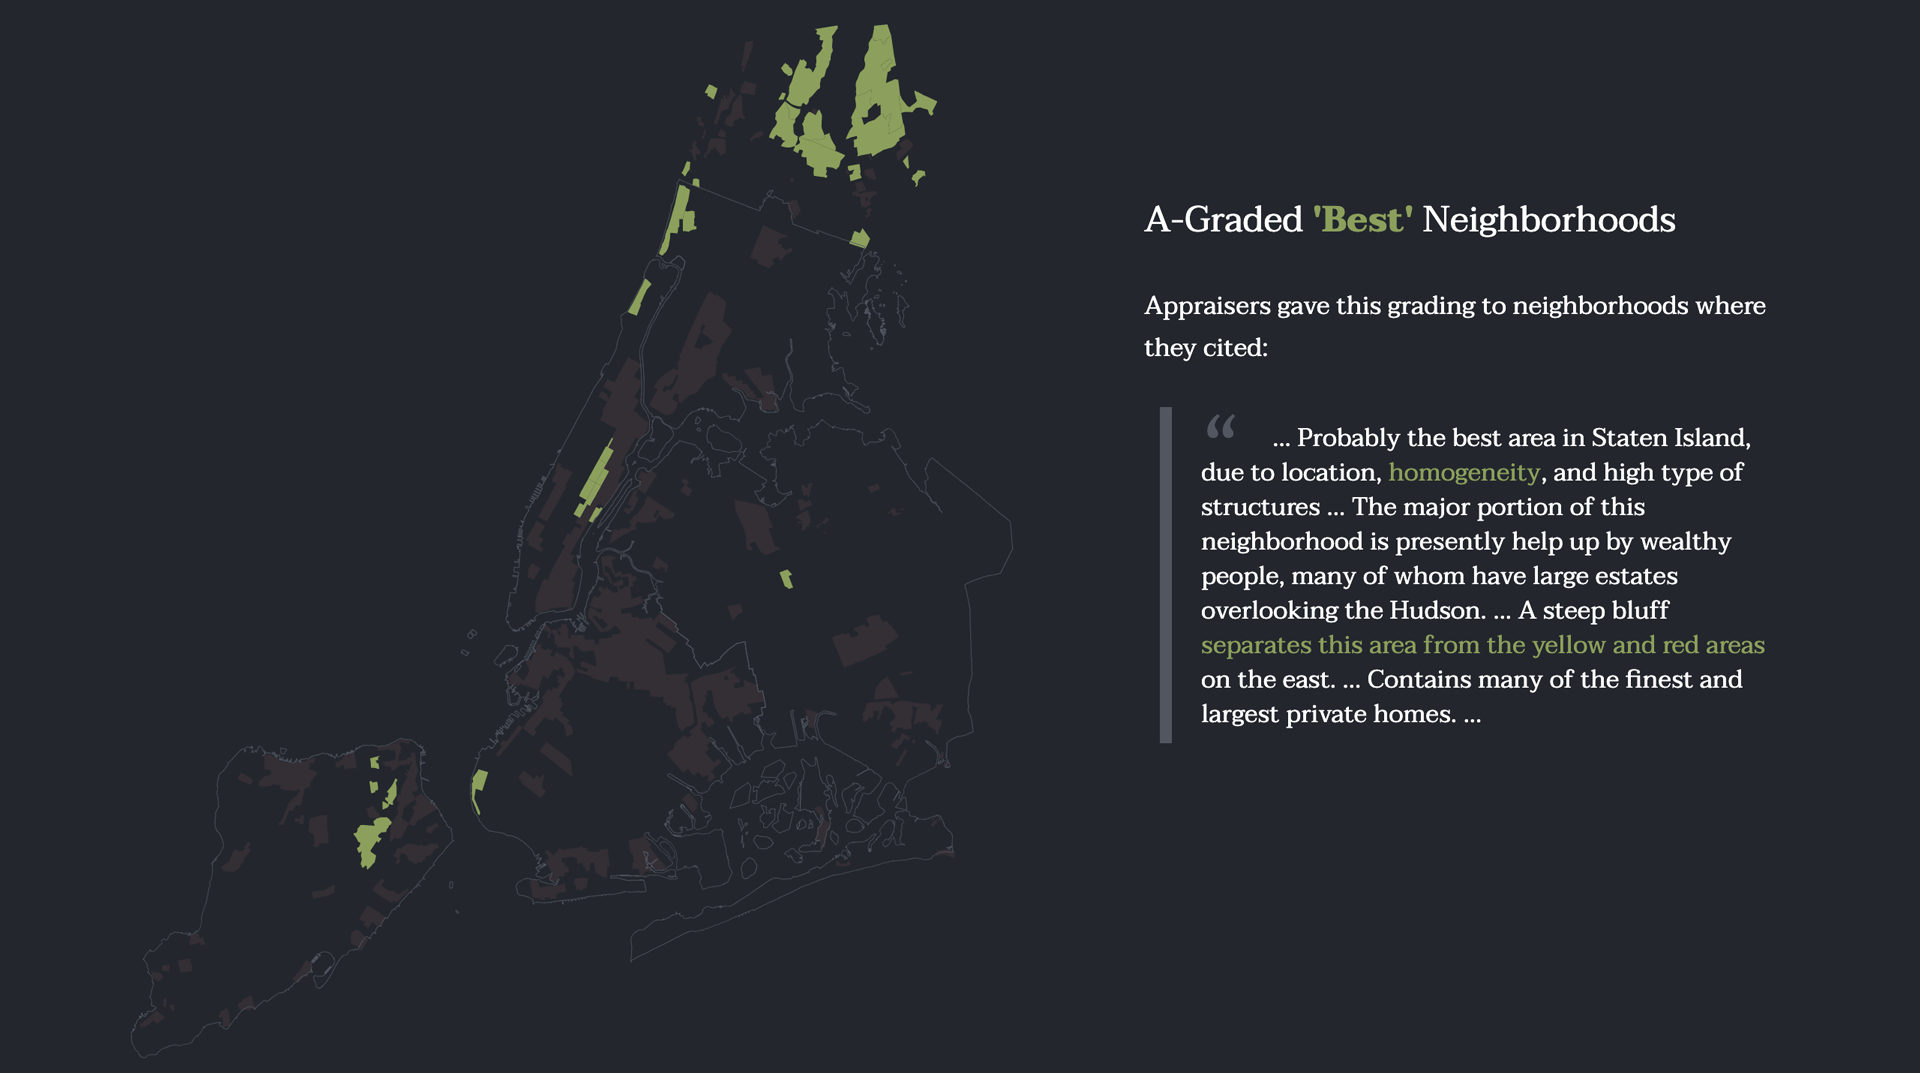
The map continually builds as we progress through this explainer section, muting the visual presence of the grades already described while highlighting the grade currently being explained.
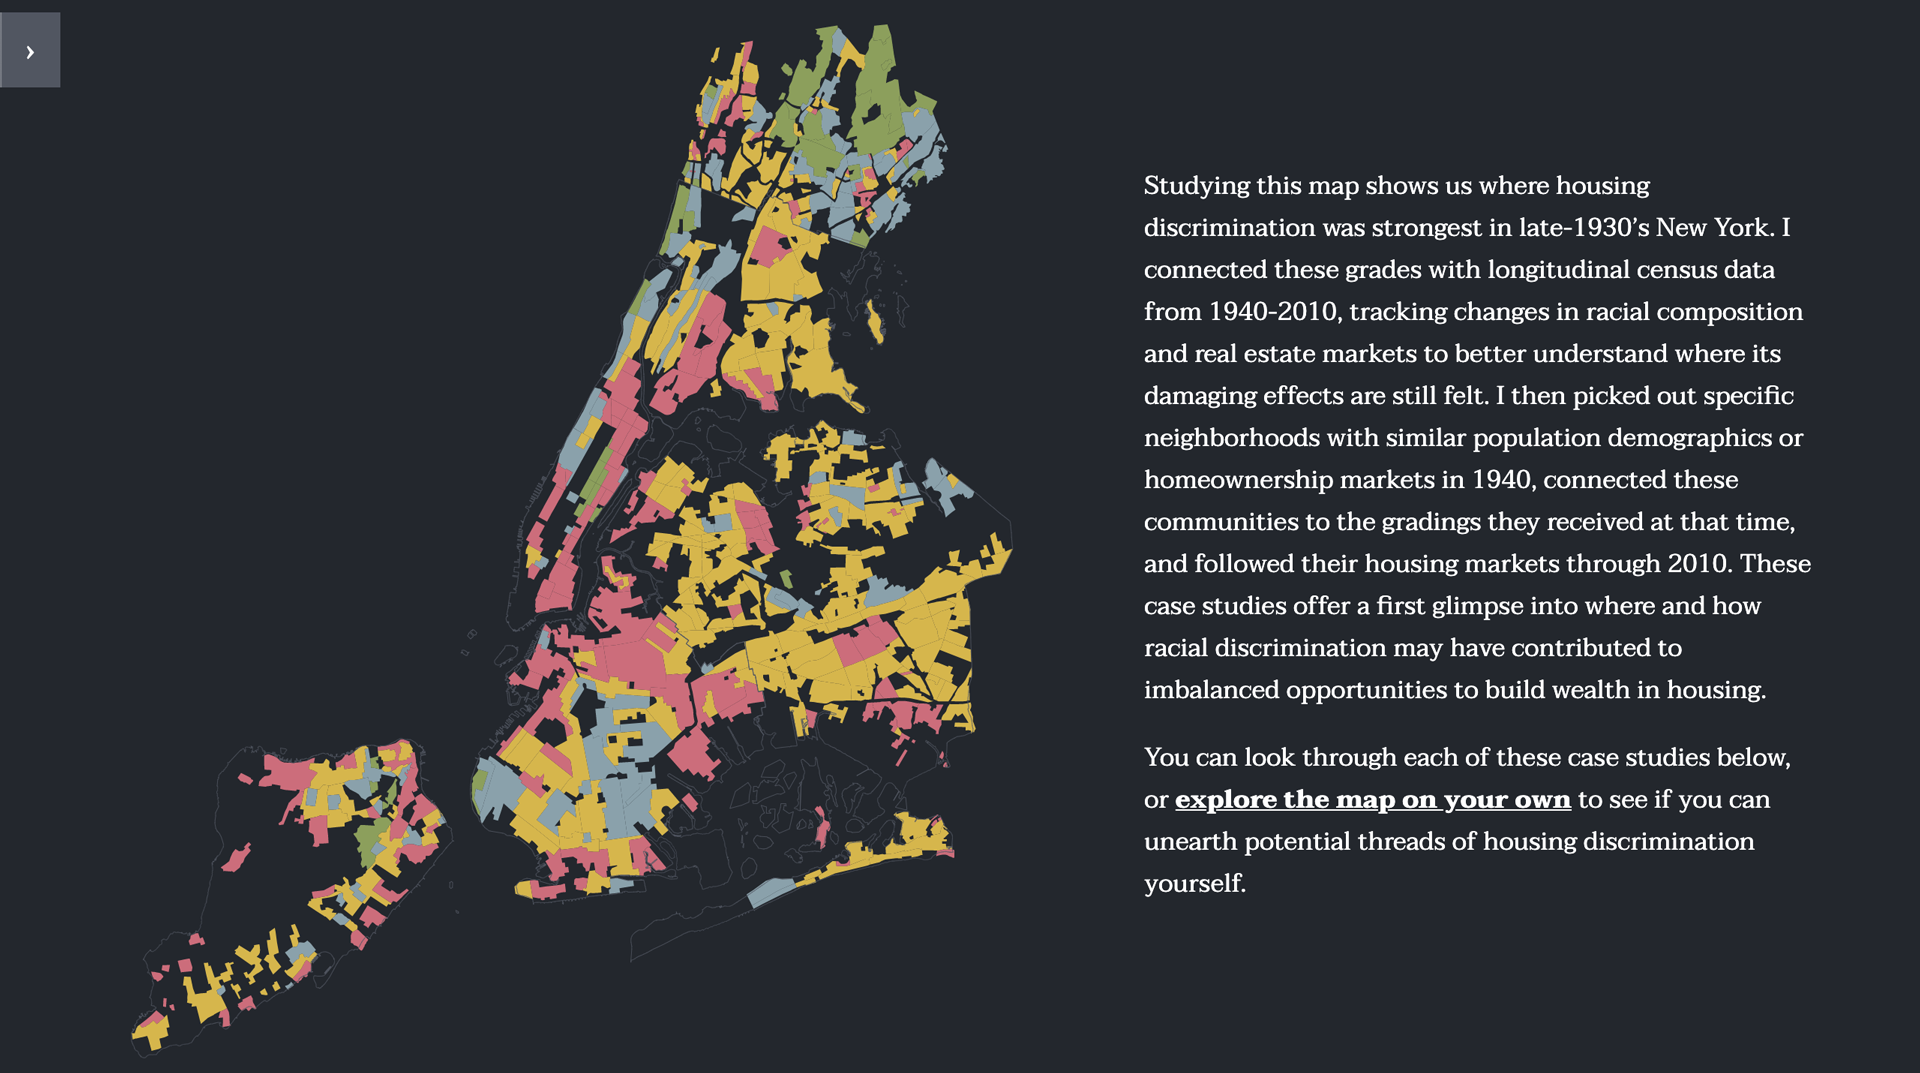
This section also gives users the first substantial insight from the project – a full redlining map showing where housing discrimination was strongest in 1930's New York City. Users can now either progress to individual neighborhood case studies or jump to explore the map on their own by clicking through the page's call to action.
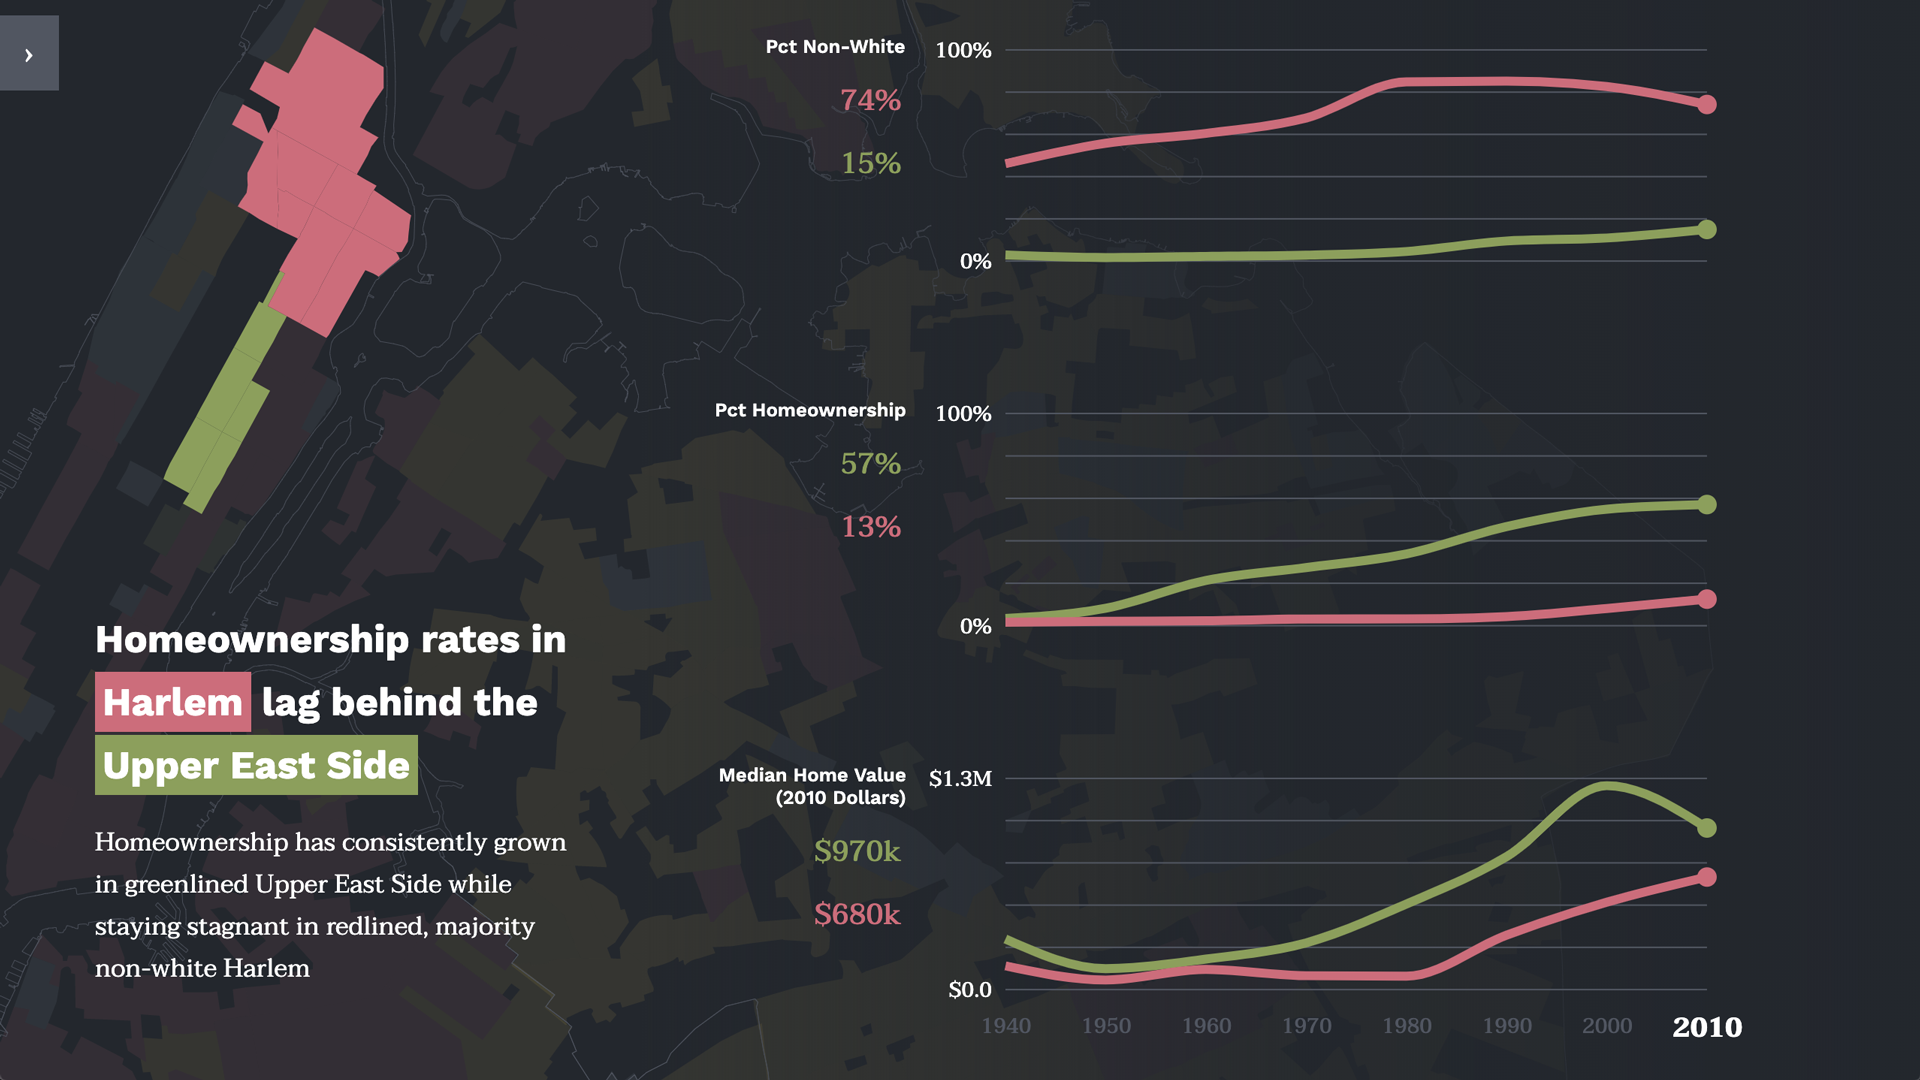
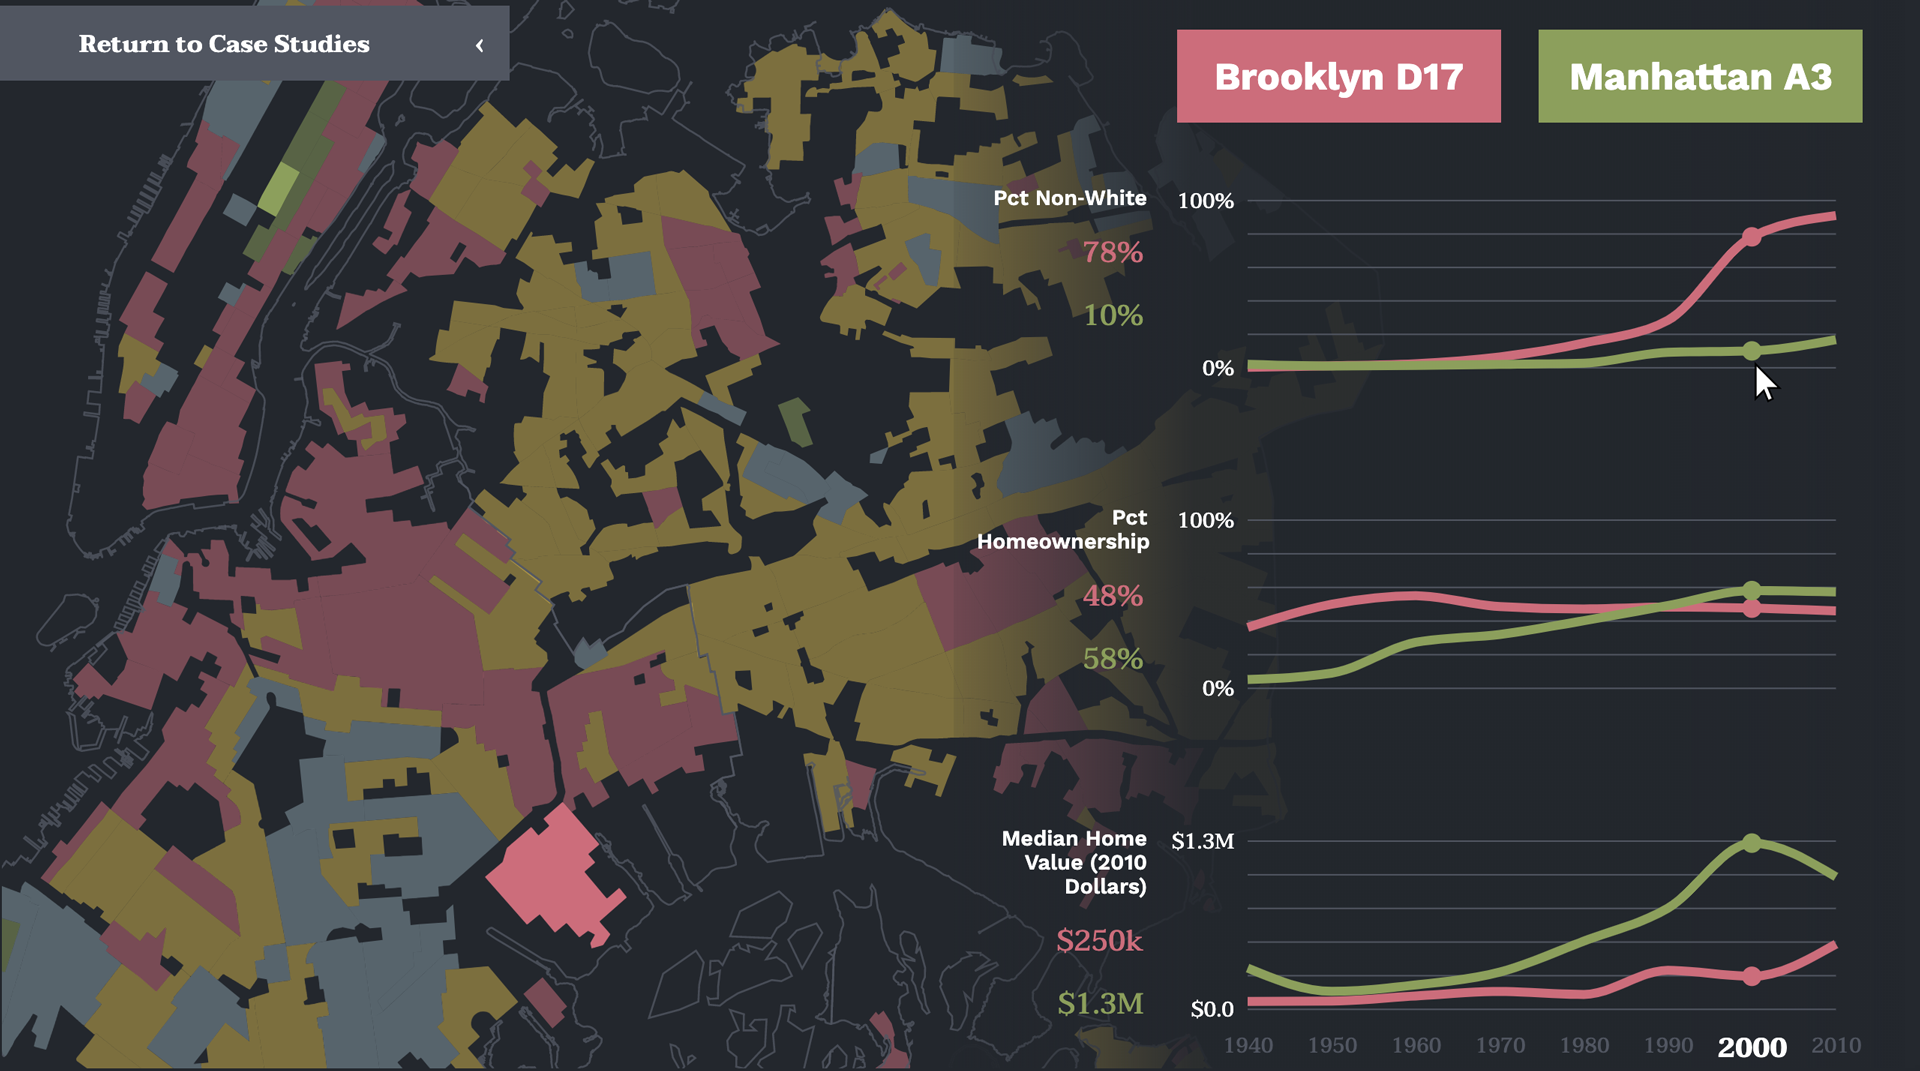
When a user proceeds to view each case study, the borough and neighborhood names being examined appear at the same time as the map on the webpage automatically pans and zooms to show the geographic boundaries of the two neighborhoods on the top left corner. As the user continues to scroll, sparklines appear that show census results over time, along with a summary of the main story and takeaway for this particular case study.
The color of each neighborhood corresponds with the redlining gradings that neighborhood received, which also matches the colors established from the earlier ‘redlining explainer’ section. The geographic zone outlines, sparklines, and takeaway text are all displayed on the screen at the same time, giving the user a full picture this case study in one view. A dark gradient behind the sparklines allows for better readability and delineates them from the map, which is still allowed to occupy the full viewport.
Users can also hover over the sparklines to see values for the metric estimates represented in an individual year (rounded to two significant digits) for both neighborhoods. During scrolling within a comparison, the takeaway text and map boundaries will stick to their positions on the page. This visual consistency allows the user constant access to each comparison’s key insight and geographic context throughout the entirety of that comparison.
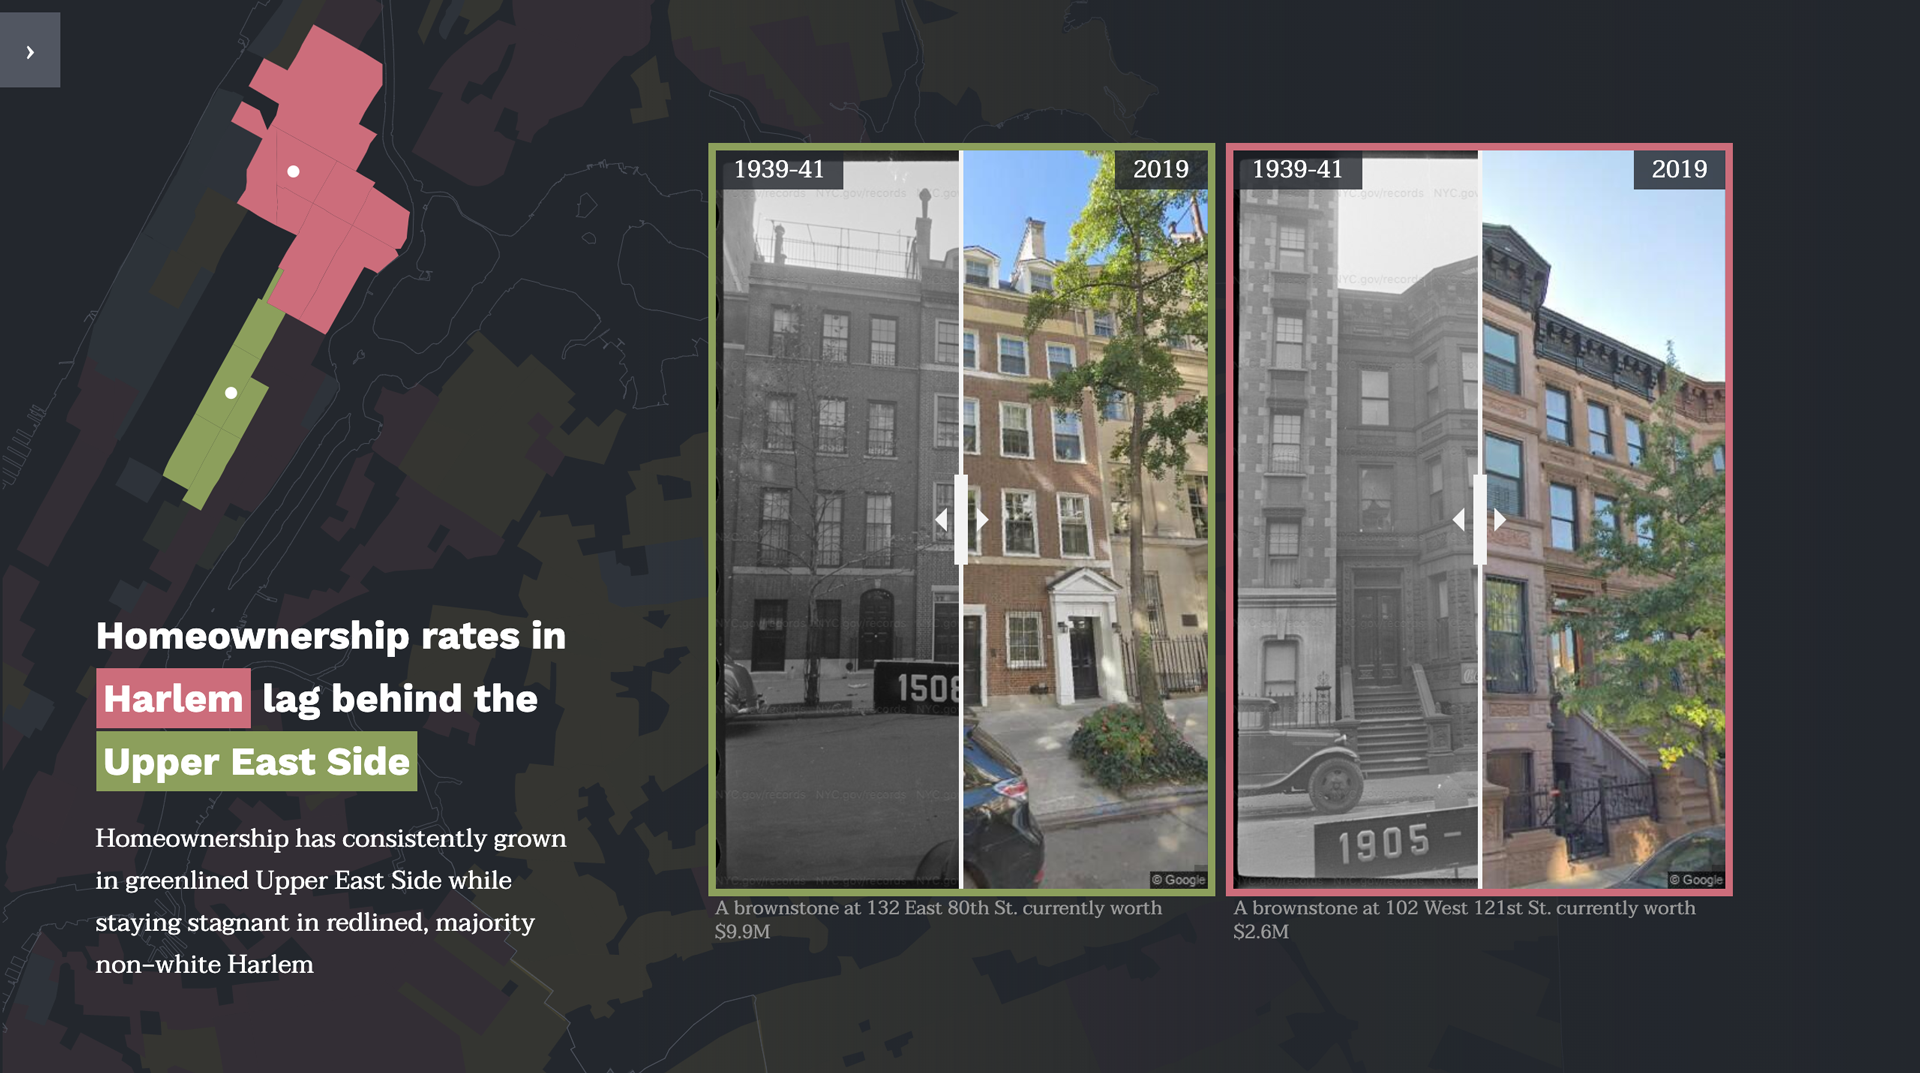
The final view within the comparison section displays two images of an individual house within each neighborhood, one in 1939-41 (from the NYC Municipal Archives) and another in 2019 (from the Google Street View Static API). Dots also appear on the map when these images are present in the view, giving the user visual context to where these houses are located within each neighborhood.
These two images show the same building at two distinct periods in time at similar angles and perspectives, allowing users to pan between the two using an interactive click-and-drag slider made possible with JuxtaposeJS.
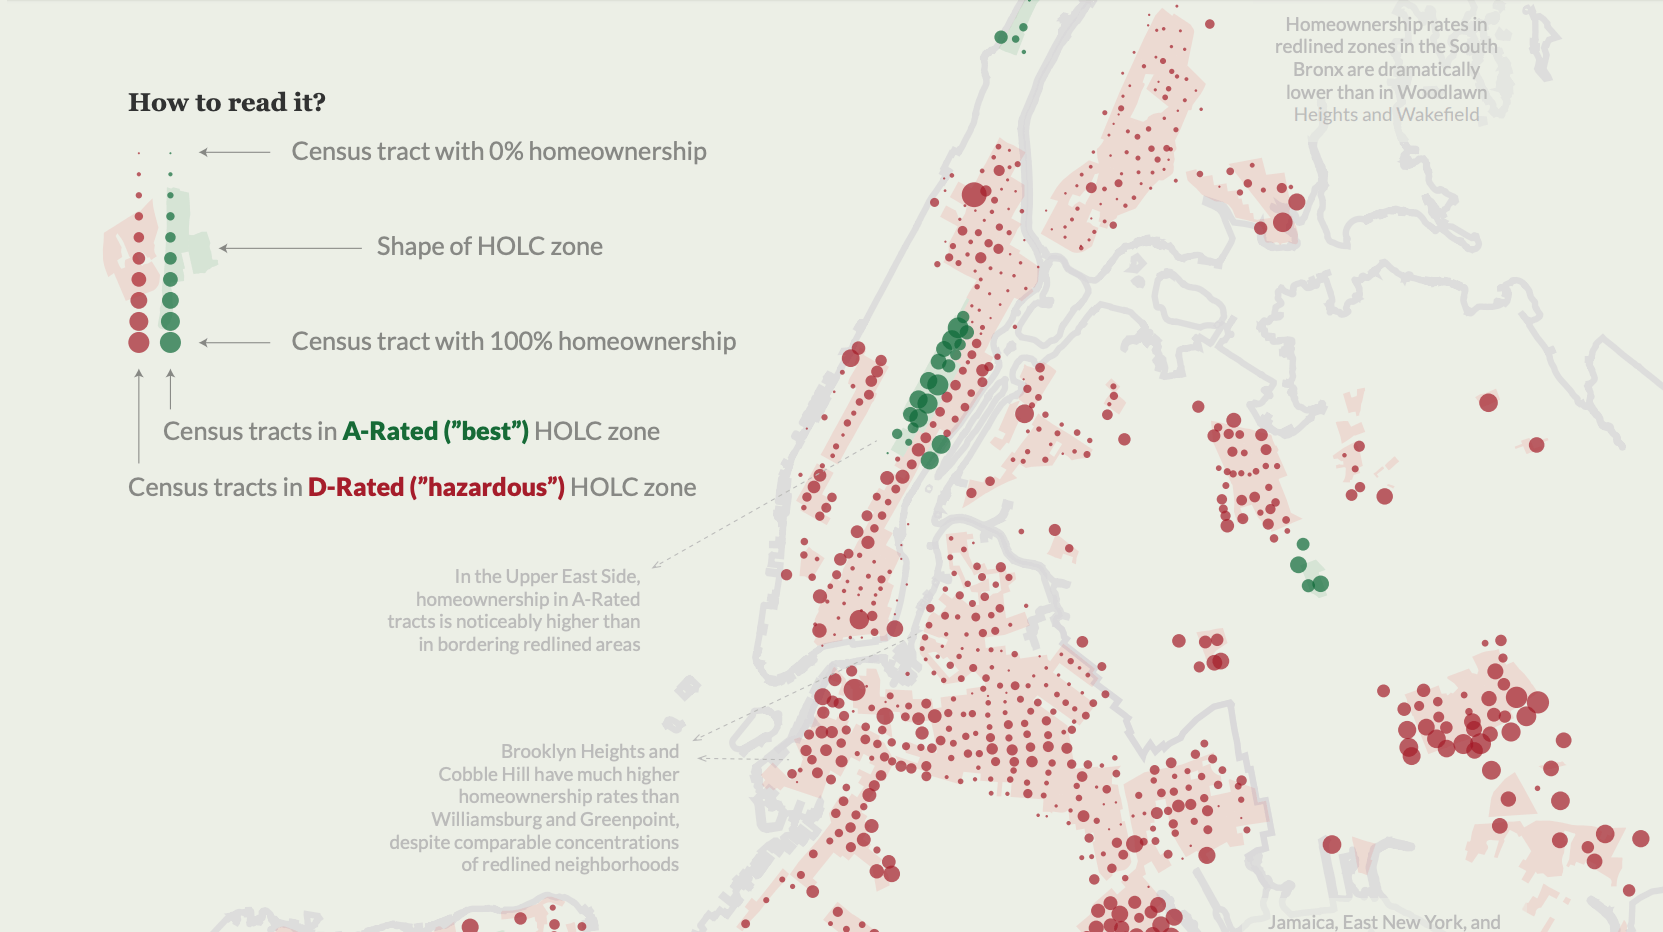
The final view within this visuailzation is the exploratory view, which allows users to pan, zoom, and explore the map of New York City. Users can hover over a zone to see sparklines for that zone populate, and can click on a zone for its sparklines to stick on the view (until another zone is clicked). Sparklines for hovered zones will also stick until another zone is hovered over, allowing lines for two different zones to appear simultaneously.
The explore view shows both the map and sparklines, visually resembling the individual neighborhood comparisons. Like the comparison view, users can also hover over these sparklines to see the values for the metric estimates represented in an individual year for both zones (clicked and hovered). The zone(s) represented in the sparklines are visually highlighted on the map through opacity – zones that are clicked or hovered will have full opacity while all other zones are slightly faded.
~~Parsons~~
New York City Redlining Poster
Like this project? Want to get in touch? Reach out!